. 2019 Jul 22;8:e46566. doi: 10.7554/eLife.46566

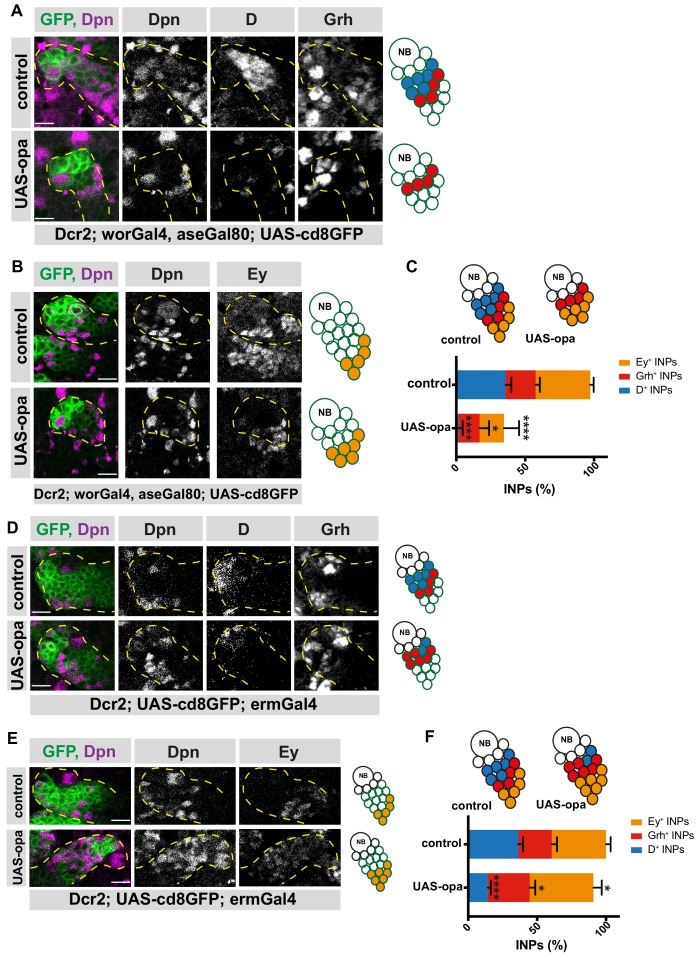
Figure 5. Opa overexpression results in the loss of D+INPs.

(A) Close-up images of control and opa overexpressing brains in type II lineages, stained for Dpn, D and Grh antibodies, lineages are outlined with yellow dashed lines, scale bar 10 μm, (induced with worGal4, aseGal80, marked with membrane bound GFP). Overexpression of opa in type II lineages causes the loss of D+ INPs. (B) Close-up images of control and opa overexpressing brains in type II lineages, stained for Dpn, and Ey antibodies, lineages are outlined with yellow dashed lines, scale bar 10 μm, (induced with worGal4, aseGal80, marked with membrane bound GFP). (C) Quantification of D+, Grh+ and Ey+ INPs in control and opa overexpressing brains, n = 10, total INP numbers in control were normalized to 100%. Data represent mean ± SD, p<=0.05, ***p<=0.001, Student’s t-test (D+ INPs control 12.18 ± 1.33 [n = 10], opa GOF 0.4 ± 0.6 [n = 10], p<0.001; Grh+ INPs control 7.38 ± 1 [n = 10], opa GOF 5.12 ± 2.20 [n = 10], p<0.05; Ey+ INPs control 13.5 ± 0.76 [n = 10], opa GOF 6 ± 3.5 [n = 10], p<0.001). (D) Close-up images of control and opa overexpressing brains in INPs, stained for Dpn, and Ey, lineages are outlined with yellow dashed lines, scale bar 10 μm, (induced with ermGal4, marked with membrane bound GFP). (E) Close-up images of control and opa overexpressing brains in INPs, stained for Dpn, D and Grh, lineages are outlined with yellow dashed lines, scale bar 10 μm, (induced with ermGal4, marked with membrane bound GFP). (F) Quantification of D+, Grh+ and Ey+ INPs in control and opa overexpressing brains, n = 5, total INP numbers in control were normalized to 100%. Data represent mean ± SD, *p<=0.05, ***p<0.001, Student’s t-test (D+ INPs control 12.4 ± 1.01 [n = 5], opa GOF 4.83 ± 0.68 [n = 5], p<0.0001; Grh+ INPs control 8.2 ± 1.16 [n = 5], opa GOF 10.33 ± 1.24 [n = 5], p<0.05; Ey+ INPs control 13.4 ± 1.01 [n = 5], opa GOF 15.71 ± 1.9 [n = 5], p<0.05).

Figure 5—source data 1. Quantification of number of INPs in three different temporal identities between control versus opa-overexpressed brains with type II-specific driver (Figure 5C).
DOI: 10.7554/eLife.46566.032
Figure 5—source data 2. Quantification of number of INPs in three different temporal identities between control versus opa-overexpressed brains with INP-specific driver (Figure 5F).
DOI: 10.7554/eLife.46566.033

Figure 5.

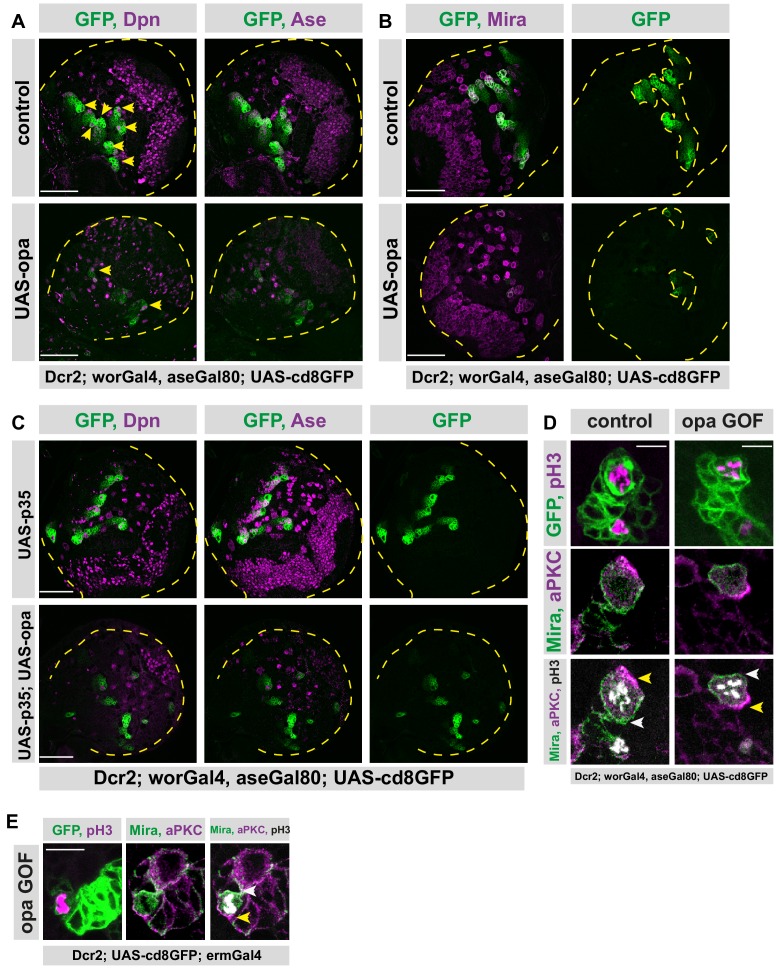
Figure 5—figure supplement 1. Opa overexpression causes shorter type II lineages.

Figure 5—figure supplement 1.

(A) Overview images of brain lobes, control or type II lineage-specific opa overexpression, stained for Dpn, and Ase antibodies, lobes are outlined with yellow dashed lines, yellow arrowheads mark Dpn positive type II NB lineages, one lineage is invisible in this z-plane, scale bar 50 μm, (induced with worGal4, aseGal80, marked with membrane bound GFP). (B) Overview images of brain lobes, control or type II lineage-specific opa overexpression, stained for Mira antibody, lobes and type II lineages are outlined with yellow dashed lines, scale bar 50 μm, (induced with worGal4, aseGal80, marked with membrane bound GFP). (C) Overexpression of apoptosis inhibitor p35 in type II lineages is not sufficient to prevent type II lineage loss upon opa overexpression. Overview images of brain lobes overexpressing opa alone and together with p35, stained for Dpn and Ase antibodies, lobes are outlined with yellow dashed lines, scale bar 50 μm, (induced with worGal4, aseGal80, marked with membrane bound GFP). (D) Close-up images of control and opa overexpressing type II NBs stained for pH3, Mira and aPKC, scale bar 10 μm, the crescents of Mira staining are marked with white arrowhead, and the crescents of aPKC staining are marked with yellow arrowhead, (induced with worGal4, aseGal80, marked with membrane bound GFP). (E) Close-up images of larval brains overexpressing opa in INPs, stained for pH3, Mira and aPKC, the crescents of Mira staining are marked with white arrowhead, and the crescents of aPKC staining are marked with yellow arrowhead, scale bar 10 μm, control is in Figure 2—figure supplement 2E (induced with ermGal4, marked with membrane bound GFP).
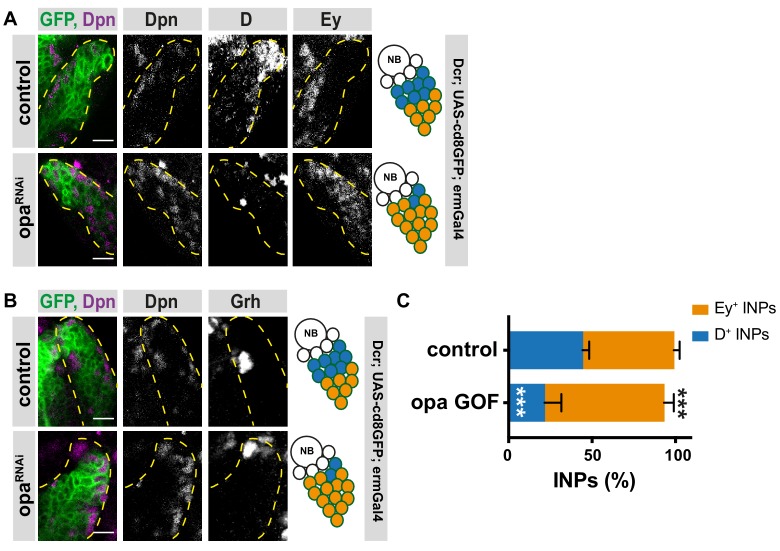
Figure 5—figure supplement 2. Opa overexpression causes loss of D+INPs in DM1 lineages.

Figure 5—figure supplement 2.

(A–B) Close-up images of larval brains overexpressing opa in type II DM1 lineages, stained for Dpn, D and Ey (A), and Dpn and Grh (B), lineages are outlined with yellow dashed line, scale bar 10 μm (induced with ermGal4, marked with membrane bound GFP). (C) Quantification of Dpn+, D+, and Dpn+, Ey+ INPs in control and opa gain-of-function brains, n = 6, total INP numbers in control were normalized to 100%. Data represent mean ± SD, ***p<=0.001, Student’s t-test. (D+ INPs control 11.33 ± 0.42 [n = 6], opa GOF 5.5 ± 1.05 [n = 6], p<0.001; Ey+ INPs control 14 ± 0.36 [n = 6], opa GOF 18.33 ± 0.61 [n = 6], p<0.001).
Figure 5—figure supplement 2—source data 1. Quantification of number of INPs in three different temporal identities between control versus opa-overexpressed brains with INP-specific driver in DM1 lineages (Figure 5—figure supplement 2C).
DOI: 10.7554/eLife.46566.034