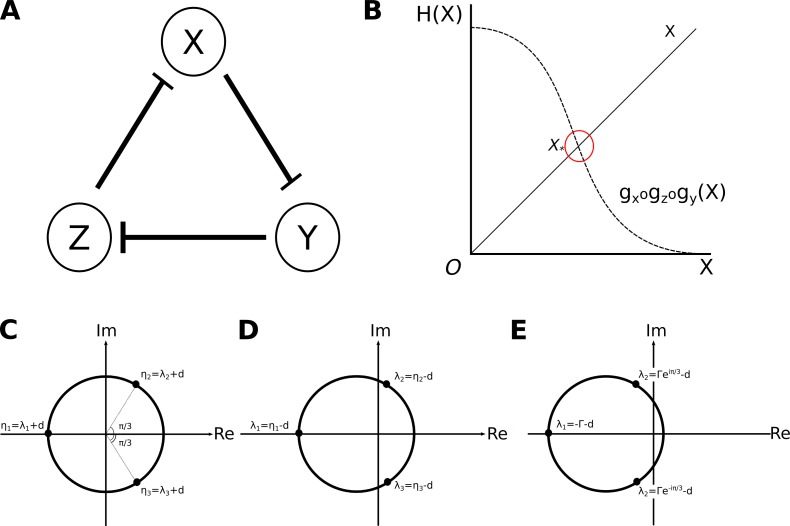
Appendix 1—figure 1. Analysis of the repressilator circuit.
(A) Structure of the repressilator circuit: the nodes of the network represent genes and their products X, Y, and Z (circles). Repressive interactions among these nodes are indicated by T-bars. We assume constitutive activation of all three nodes. (B) Uniqueness of solutions: solutions of Equation (7) are defined by intersections of the curves given by and . In this particular case, the shape of both curves results in them intersecting at only one value of , , and therefore there is only one solution. (C) Complex roots of is a real negative number, therefore it has one real negative, and two complex roots: , and . (D, E) Two different sets of possible eigenvalues: (D) Eigenvalues of a saddle point. One of the eigenvalues associated with the steady state has a negative real part, while the other two have positive real parts. In this case, the steady state is a saddle point. The uniqueness of the steady state, and the nature of the regulation-expression functions we’ve chosen, allows us to infer the presence of a limit cycle driving stable oscillations. (E) Eigenvalues of a stable spiral sink. All eigenvalues associated with the steady state have negative real parts and two of them are complex. In this case, the steady state is a stable spiral sink, which drives damped oscillations.

