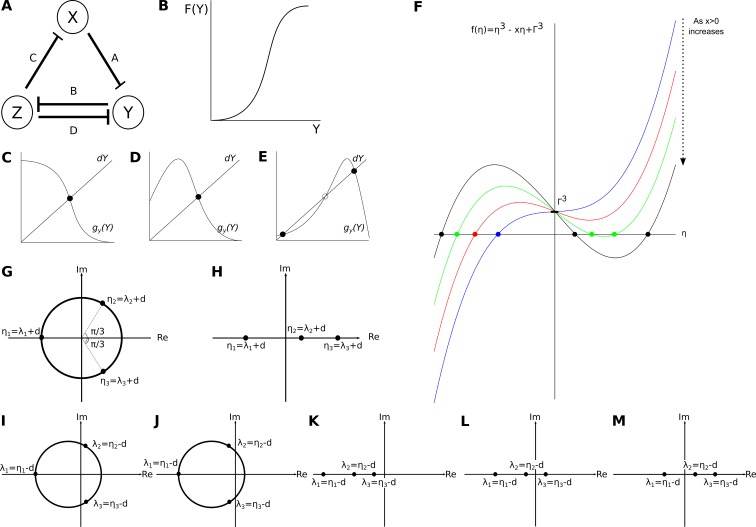
Appendix 1—figure 2. Analysis of the AC/DC circuit.
(A) Structure of the AC/DC circuit: the nodes of the network represent genes and their products X, Y, and Z (circles). T-bars represent the repressive interactions between the genes, where A,B,C and D denote the strengths of those respressions. Repressive interactions among these nodes are indicated by T-bars. We assume constitutive activation of all three nodes. (B) General shape of the function given by . (C–E) Effect of increasing the back reaction on the number of steady states. Functions as defined in the text. (C) No back reaction: there is only one intersection point. (D) Weak back reaction: still, there is only one intersection point. (E) Strong back reaction: now there are three intersection points. (F) The simplified characteristic Equation (27) defines a depressed cubic. Its dependence on parameter values is shown. (G,H) Roots of the depressed cubic given by Equation (27). (G) Option 1: one real negative root, and two complex roots with positive real part. (H) Option 2: real roots, where one has negative real part and two have positive real parts. (I–M) Combinations of eigenvalues for steady states in the AC/DC circuit. (I) Unstable spiral sink: a steady state with one real negative eigenvalue and two complex eigenvalues with positive real parts. (J) Stable spiral sink: a steady state with one real negative eigenvalue and two complex eigenvalues with negative real parts. (K) Point attractor: a steady state with real negative eigenvalues. (L) Saddle1,2: a steady state with real eigenvalues where one is positive and two are negative. (M) Saddle2,1: a steady state with real eigenvalues where two are positive and one is negative.

