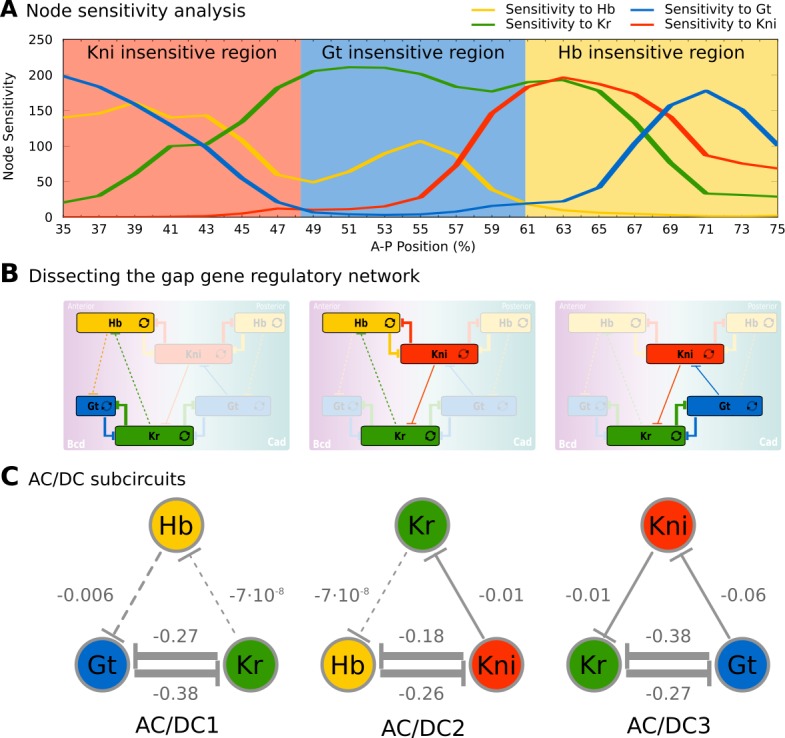
Figure 2. Identification of dynamical modules in the gap gene system.

(A) Node sensitivity analysis. The plot shows sensitivity of model output to the removal of hb (yellow), Kr (green), kni (red) and gt (blue). Y-axis represents node sensitivity as defined in ‘Materials and methods,’ Equation (4); X-axis represents A–P position in %, where 0% is the anterior pole. Regions insensitive to the absence of specific gap genes are indicated by background colour. (B) Dissecting the gap gene network into dynamical modules. Network schemata as in Figure 1B. Subcircuits active in each region identified in (A) are highlighted. (C) AC/DC subcircuits. All subcircuits identified in (A) and (B) share the same regulatory structure, indicated by T-bar connectors. Numbers indicate strength of interactions (in arbitrary units). Maternal inputs and auto-activation are omitted for clarify. Note that there is a fourth AC/DC subcircuit posterior of the region included in the present analysis (not shown, see ‘Materials and methods’). See text for details.
