. 2019 Jun 6;8:e42832. doi: 10.7554/eLife.42832

Figure 3. AC/DC subcircuits faithfully reproduce the dynamics of the full model.

(A) Spatio-temporal dynamics of gap gene expression in the trunk region of the embryo. Coloured areas show the position of gap domains for hb (yellow), Kr (green), kni (red), and gt (blue). Y-axis represents time (flowing downwards) during cleavage cycle C14A. Time classes T1–eight as defined in Figure 1. X-axis represents % A–P position, where 0% is the anterior pole. Regions of influence for each AC/DC subcircuit is indicated by grey lines. Black dotted line indicates the bifucation at 52% position separating static from shifting gap domain boundaries. (B) Comparative dynamical analysis of AC/DC subcircuits and the full model. Instantaneous phase portraits of AC/DC1 (nucleus at 37%), AC/DC2 (nuclei at 49 and 59%), and AC/DC3 (nucleus at 63% A–P position) are shown. Point attractors are shown as spheres, spiral sinks as cylinders, saddles as cubes. Colour code indicates time class, from T1 (dark red) to T8 (yellow). Trajectories from simulations of AC/DC subcircuits are shown in turquoise, trajectories from simulations of the full model in black. Axes represent concentrations of gap proteins (in arbitrary units) as indicated. See ‘Materials and methods’ for model definition and details on phase space analysis.
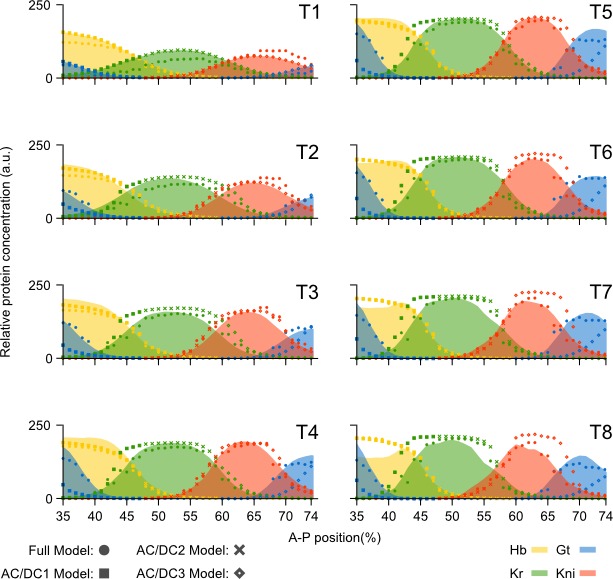
Figure 3.

Figure 3—figure supplement 1. Comparison of AC/DC subcircuits and the full model.

Figure 3—figure supplement 1.

Model output (represented by dots for the full model, and symbols for the AC/DC subcircuits) is shown compared to quantitative spatio-temporal gene expression data (coloured areas) for each time class T1–T8 during cleavage cycle 14 (C14). Subcircuits AC/DC1 (squares), AC/DC2 (crosses), and AC/DC3 (diamonds) were simulated in their respective regions of influence (35-47% for AC/DC1, 49-59% for AC/DC2, and 61-75% for AC/DC3). hb shown in yellow, Kr in green, kni in red, and gt in blue. Y-axes represent relative protein concentration in arbitrary units (a.u.); X-axes represent A–P position in %, where 0% is the anterior pole. Only the trunk region of the embryo from 35 to 75% is shown.
Figure 3—figure supplement 2. Comparative dynamical analysis of AC/DC subcircuits and the full model.
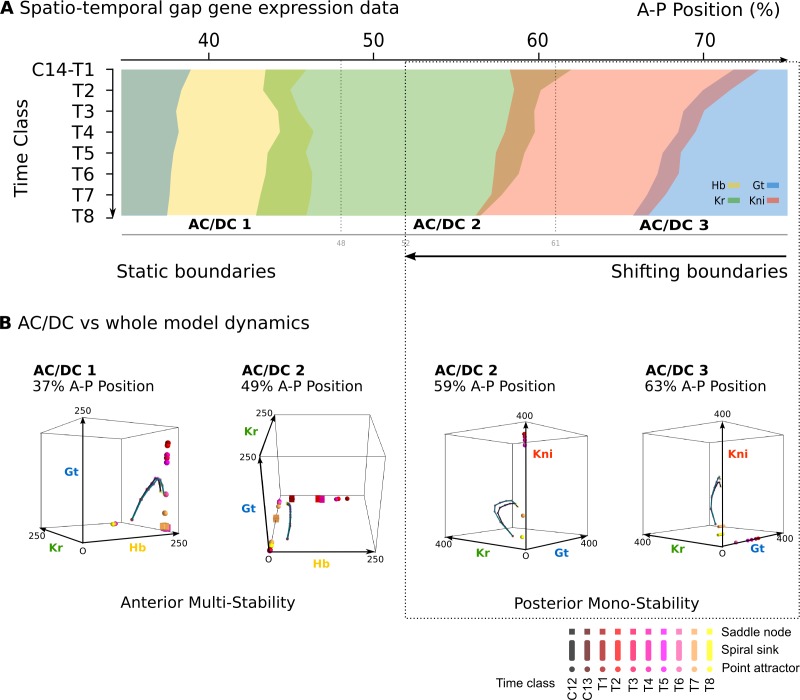
Figure 3—figure supplement 2.

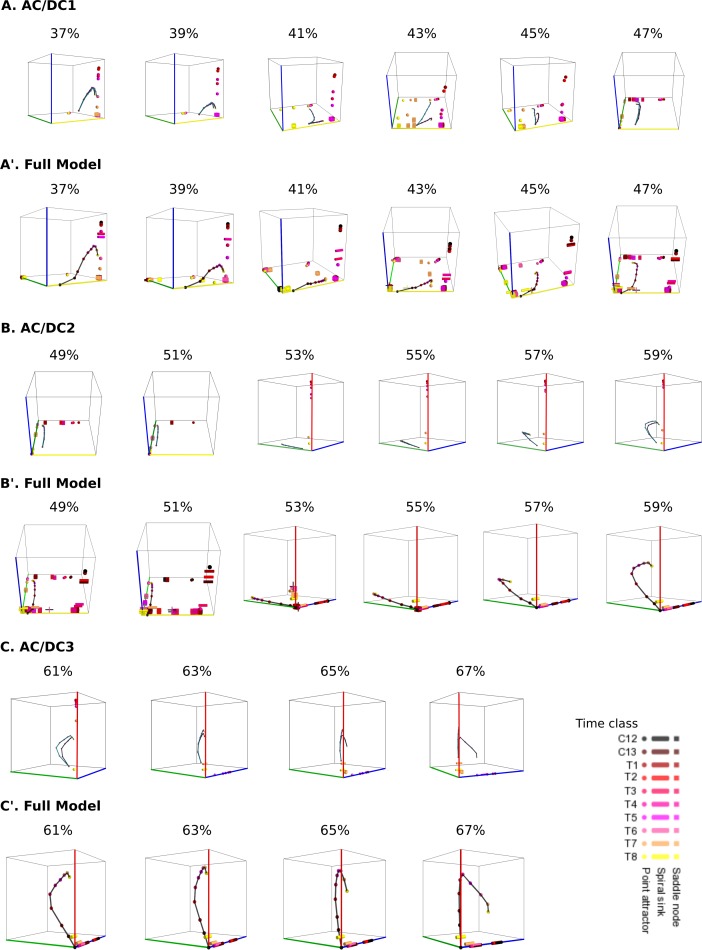
In all phase portraits point attractors are shown as spheres, spiral sinks as cylinders, saddles as cubes. Colour code indicates time class, from C12 (black) to T8 (yellow). Trajectories simulated from AC/DC subcircuits are shown in turquoise and trajectories from simulations of the full model in black. (A) Instantaneous phase portraits of AC/DC1 (A) and the full model (A’) in nuclei between 37 and 47% A–P position. (B) Instantaneous phase portraits of AC/DC2 (B) and the full model (B’) in nuclei between 49 and 59% A–P position. (C) Instantaneous phase portraits of AC/DC3 (C) and the full model (C’) in nuclei between 61 and 67% A–P position. (A, B, C) show trajectories of both AC/DC1 (turquoise) and the full model (black) from C14A-T1 to T8; (A’, B’, C’) show trajectories of the full model from C12 to C14A-T8 (black). Point attractors are shown as spheres, spiral sinks as cylinders, saddles as cubes. Colour code indicates time class, from C12 (black) to T1(dark red) to T8 (yellow). Axes represent concentrations of gap proteins (in arbitrary units) as indicated. See ‘Materials and methods’ for model definition and details on phase space analysis.