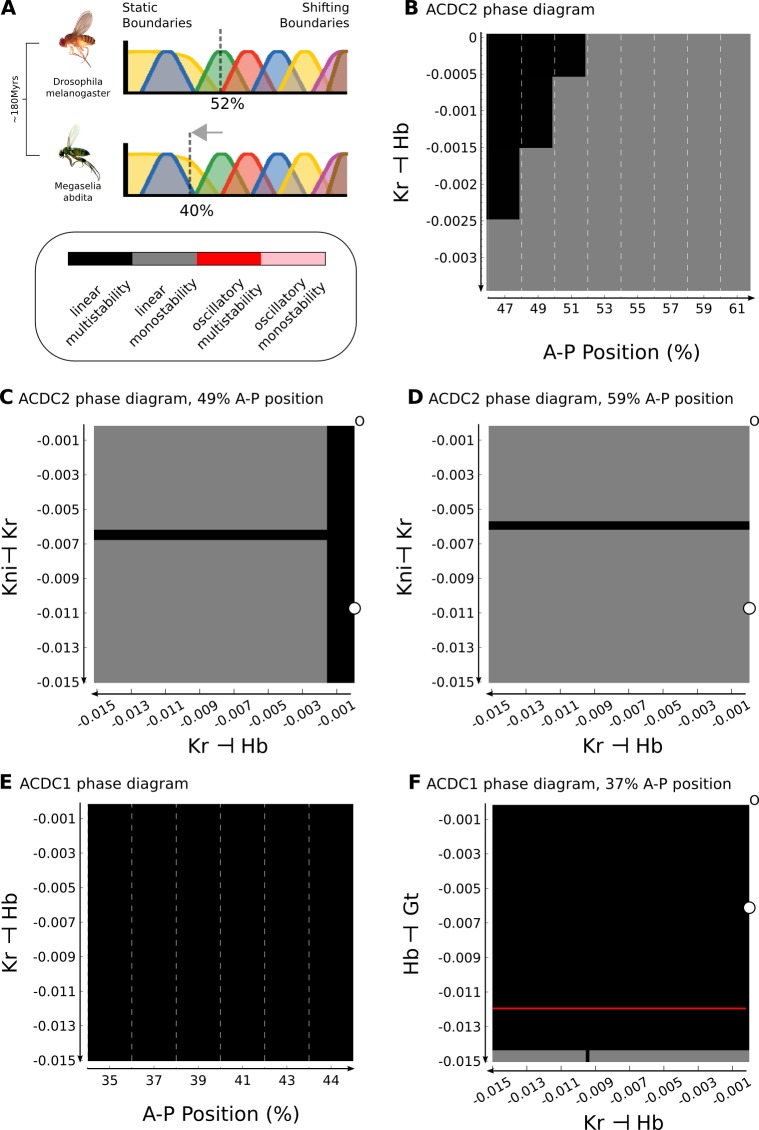
Figure 5. Inter-species lability of the bifurcation boundary depends on altered gap-gap interactions.
(A) The position of the bifurcation boundary separating static and shifting gap gene expression domains differs between D. melanogaster (upper panel, 52%) and M. abdita (lower panel, 40% A–P position). The difference between species is highlighted by a grey arrow. Phylogenetic distance between the two species is indicated to the left in ‘million years ago’ (mya). (B) Phase diagram for AC/DC2 in response to altering the strength of hb repression by Kr (plotted against A–P position). (C, D) Phase diagram for AC/DC2 in response to altering both hb repression by Kr (X-axis) and Kr repression by Kni (Y-axis) shown for subcircuits in nuclei at 49 (C) and 59% (D) A–P position. (E) Phase diagram for AC/DC1 in response to altering the strength of hb repression by Kr (plotted against A–P position). (F) Phase diagram for AC/DC1 in response to altering both hb repression by Kr (X-axis) and gt repression by Hb (Y-axis) shown for the subcircuit in the nucleus at 37% A–P position. (A–F) Background indicates dynamical regimes as in Figure 4: the multistable anterior regime is shown in black, the monostable posterior regime in grey. In addition, there is a narrow strip of a multistable oscillatory regime in (F) (shown in red). All Phase diagrams were calculated with maternal gradient concentrations fixed to their values at T1. See text for details.

