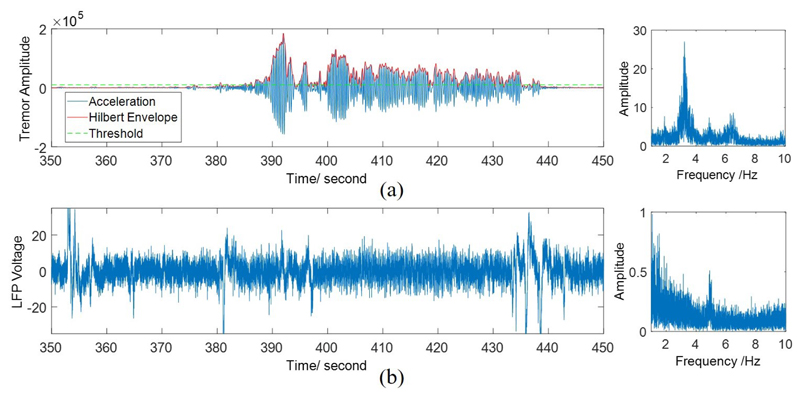
Fig. 2.
(a) Threshold method for tremor labeling. The left figure represents the time-domain acceleration, its envelope after band-pass filtering, and applied threshold, while the figure on the right shows the power spectrum of acceleration. (b) One channel of the raw LFP signal (left), and its power spectrum (right).

