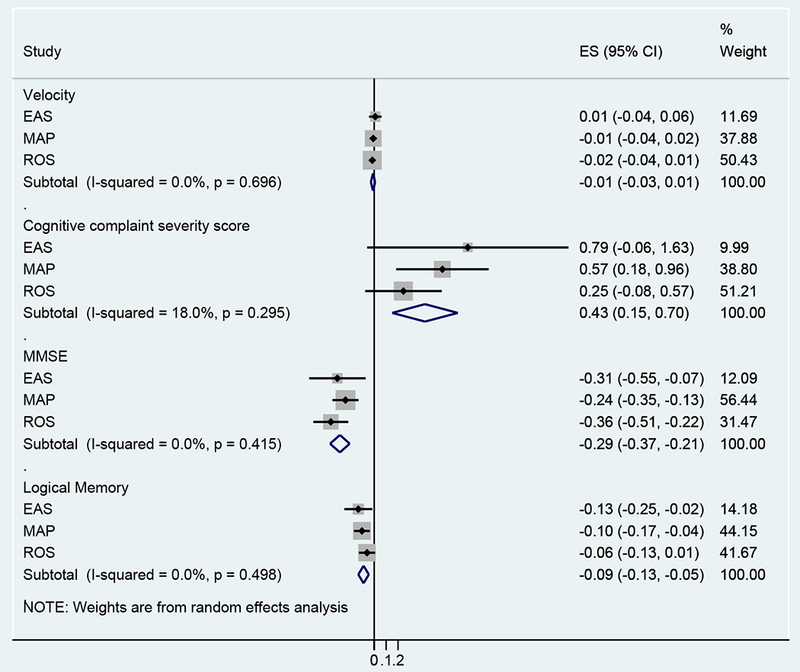
Figure 1. MCR transition to Incident dementia: cognitive and motoric predictors.

The estimates (ES) are the log of Hazard Ratios. For each study the ES are graphically represented by dots and the horizontal bars represent the 95% confidence intervals. The grey boxes surrounding the dot graphically represent study weighting in the analysis, which is also shown in the last column. The diamond is the pooled estimate. EAS: Einstein Aging Study; MAP: Memory and Aging Project; ROS: Religious Orders Study
