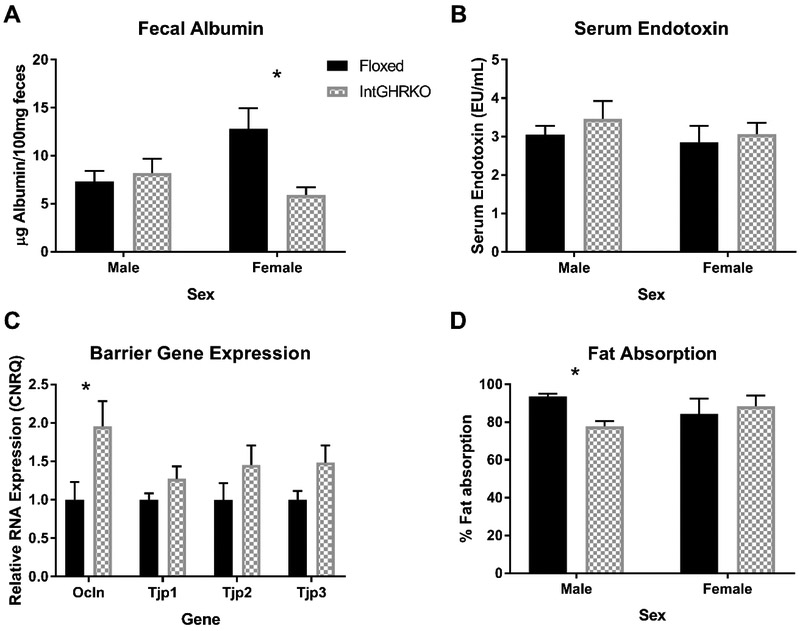
Figure 6. Gut barrier function and Fat absorption.
A: Measurement of fecal albumin concentrations using bromocresol green assay (n=7). B: Serum endotoxin measurement using a LAL assay (n=6-10). C: RNA expression of gut barrier-related genes measured with quantitative PCR (n=7). D: A specialized diet using sucrose polybehenate was used to determine efficiency of fat absorption in the intestines. (n=3/sex/genotype). *indicates p<0.05

