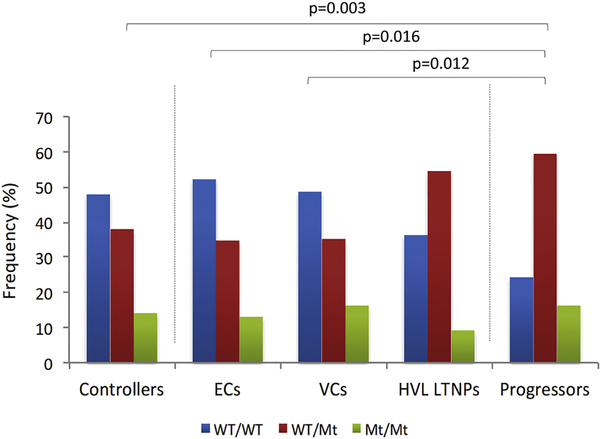
Figure 2.
Bar graph showing the genotypic frequency of 5’UTR-2SNP-hap (−2459G>A and −2135T>C) in black South African controllers, controller subgroups (ECs, VCs and HVL LTNPs) and progressors. ECs: elite controllers, VCs: viraemic controllers, HVL LTNPs: high viral load long-term non-progressors. WT: wild type allele, Mt: mutant allele

