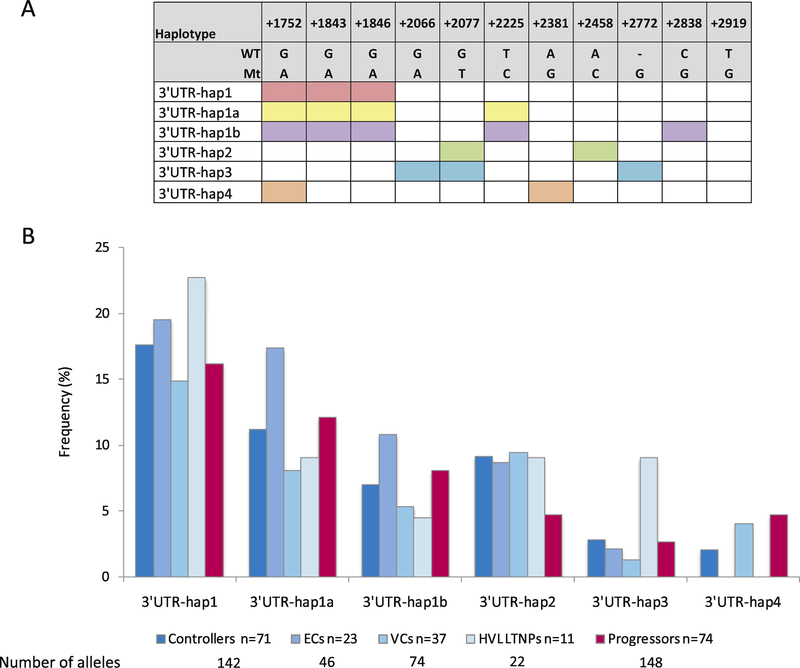
Figure 4.
A. Schematic showing polymorphisms that form each haplotype. Colour shaded boxes show the respective SNPs or indels that form each haplotype B. Bar graph showing the allelic frequencies (%) of CCR5 3’UTR haplotypes in black South African controllers, controller subgroups (ECs, VCs and HVL LTNPs) and progressors. ECs: elite controllers, VCs: viraemic controllers, HVL LTNPs: high viral load long-term non-progressors. WT: wild type allele, Mt: mutant allele

