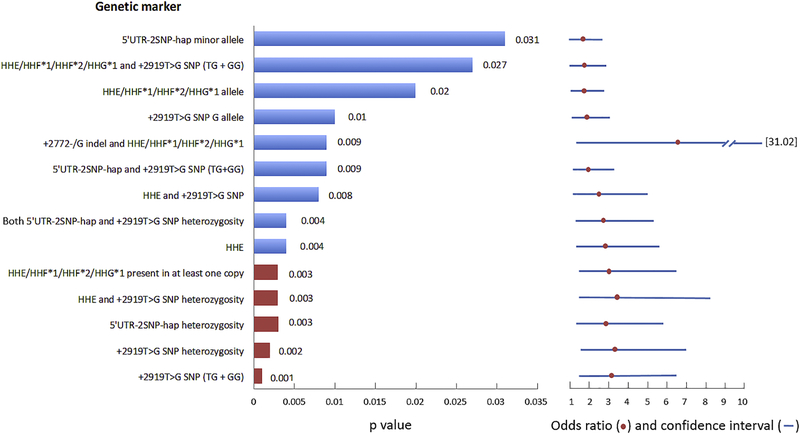
Figure 6.
Schematic showing a summary of the p values of all significant CCR5 genetic markers predictive of HIV-1 progression in black South Africans (HIV-1 total controllers vs. progressors). The smaller the p value is, the more predictive the biomarker. Red bars indicate p values that maintain significance post correction for multiple comparisons (Bonferroni). Blue horizontal lines indicate the 95% confidence intervals and the red circles indicate the odds ratios for the respective comparisons

