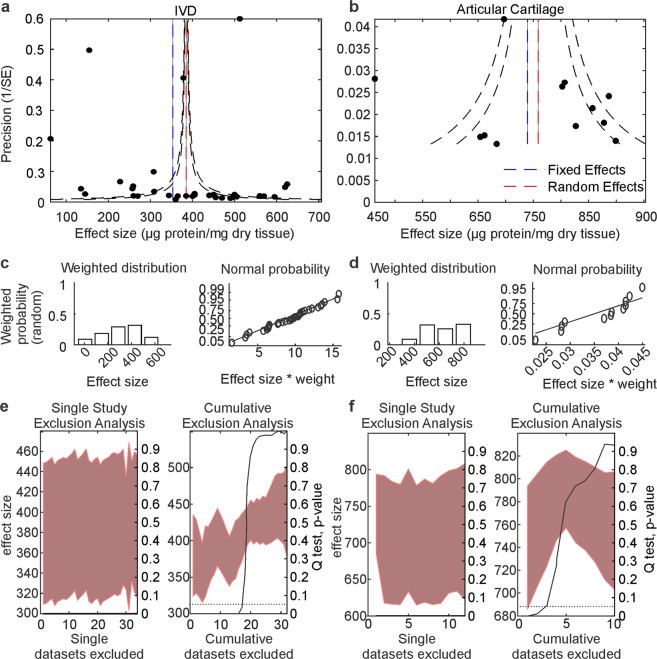
Figure 2.
The data distribution and inter-dataset heterogeneity. (a,b) Funnel plots indicating bias and heterogeneity for collagen estimates in IVD (a) and articular cartilage (b). Blue lines: fixed effect model estimates, red lines: random effects model estimates; black lines: expected 95% confidence interval in the absence of bias/heterogeneity. (c,d) Histograms and normal probability plots for distribution of collagen estimates in IVD (c) and articular cartilage (d). (e,f) Single study (left) and cumulative (right) exclusion analysis for collagen estimates in IVD (e) and articular cartilage (f).

