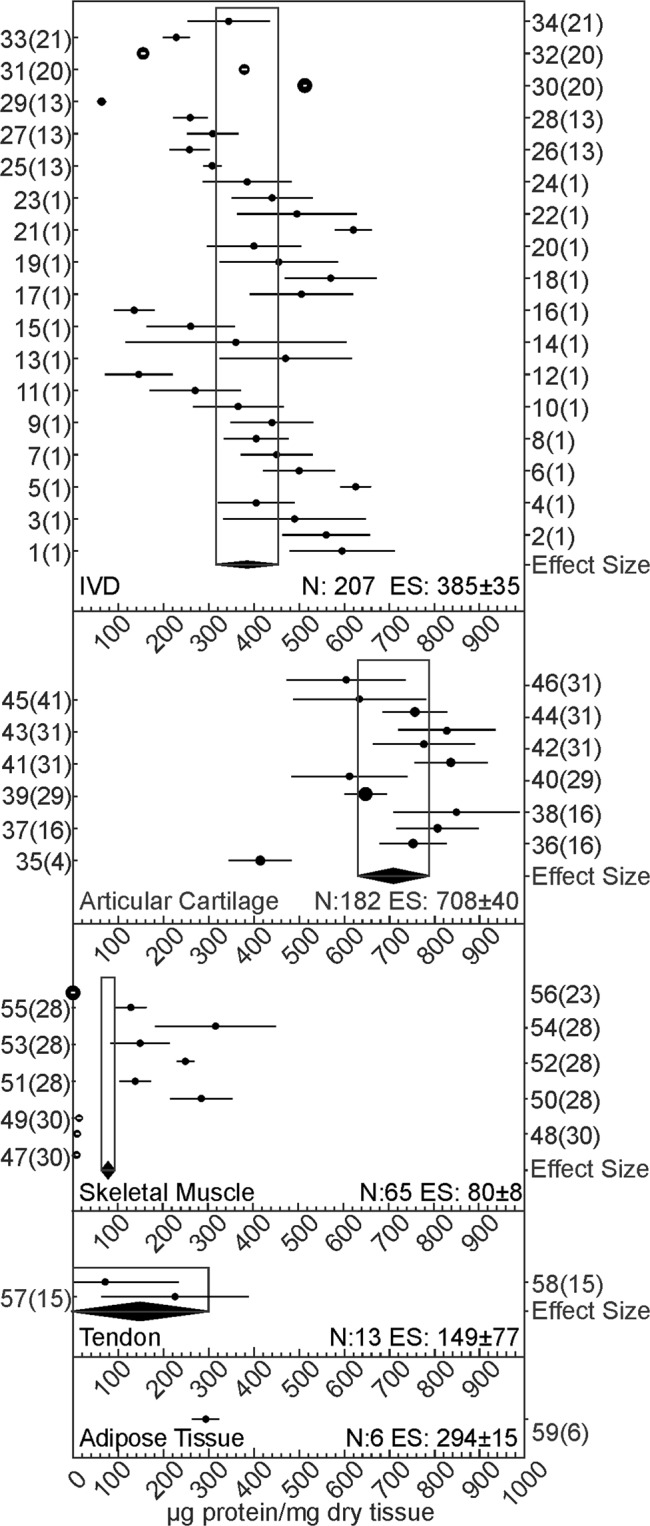
Figure 3.

Collagen abundance in connective tissue. Forest plot for the estimated collagen abundance in IVD, articular cartilage, skeletal muscle, tendon, and adipose tissue. Shown are the effect sizes (black dots) with 95% CI (black lines) for each dataset included in the analysis and the overall effect sizes (ES) with 95% CI (black diamonds) for each tissue type. Y-axis labels indicate the included datasets and study numbers in the format dataset(study) according to Supplemental Table 1, where extended information can be found. The size of the circle is proportional to the number of datasets.
