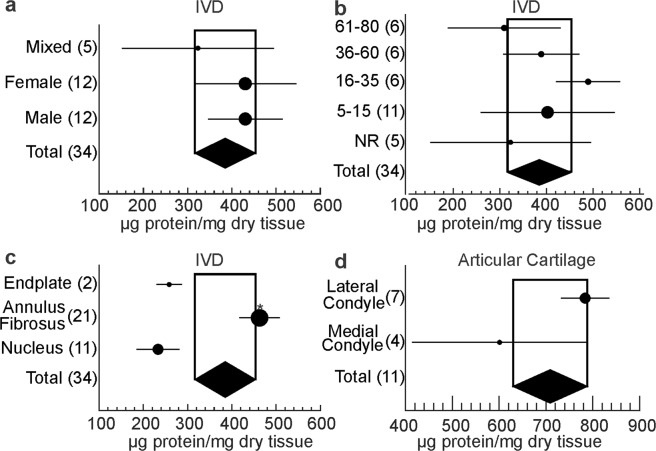
Figure 5.
Estimating the contribution of biological factors to collagen abundance in IVD and articular cartilage. Forest plot for the estimated collagen abundance in IVD (a–c) and articular cartilage (d) as a function of sex (a), age (b), and tissue sub-location (c,d). Shown are subgroup averages and 95% CI as black dots/black lines, the overall effect sizes and 95% CI as black diamond, the number of datasets included within each subgroup is indicated in parenthesis. The size of the circle is proportional to the number of datasets; *indicates statistical significance.

