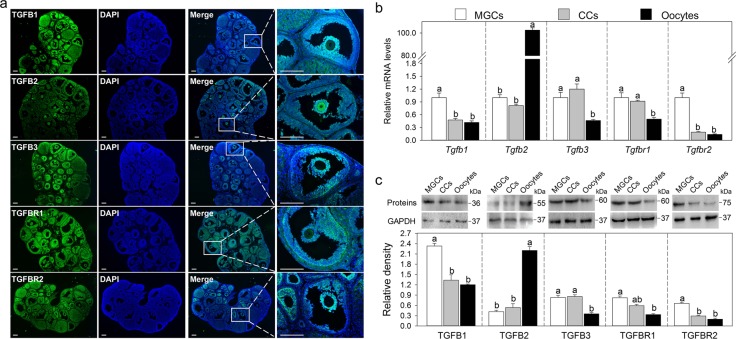
Fig. 1. The expression pattern of TGF-β ligands and receptors in mouse ovaries.
a Immunofluorescence analysis of TGFB1, TGFB2, TGFB3, TGFBR1, and TGFBR2 in the ovaries isolated from eCG-primed mice. The images are representative of three images captured. The small white boxes indicate the enlarged areas as shown in the following images. Scale bars: 200 μm. b Comparison of steady-state levels of Tgfb1, Tgfb2, Tgfb3, Tgfbr1, and Tgfbr2 mRNA in MGCs, cumulus cells (CCs) and oocytes isolated from eCG-primed mice. c Representative western blotting of TGFB1, TGFB2, TGFB3, TGFBR1, and TGFBR2 in MGCs, CCs and, oocytes isolated from eCG-primed mice. GAPDH was used as a loading control. Bars indicate the mean ± SEM of three independent replicates. Values not indicated by the same letter are significantly different (P < 0.05)

