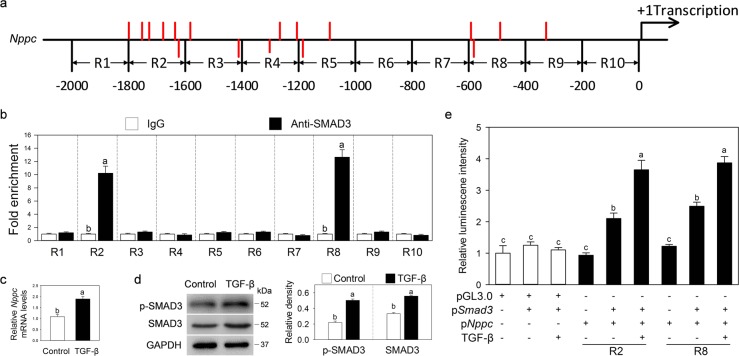
Fig. 5. SMAD3 directly regulates Nppc gene transcription.
a Schematic diagram showing the putative SMAD3-binding elements (SBE, AGAC) in the mouse Nppc promoter. The Nppc promoter sequence was divided into ten regions (designated R1–R10). Each region denotes 200 bp. Red lines represent the potential SMAD3-binding sites in the Nppc promoter. The red lines below the axis represent the potential SMAD3-binding sites in the Nppc promoter complementary chain. b ChIP-qPCR analysis of the interaction between SMAD3 protein and the Nppc promoter in MGCs. c, d Effects of TGF-β on the levels of SMAD3 and phosphorylated SMAD3 (p-SMAD3) protein (c) and Nppc mRNA (d) in KK1 cells. KK1 cells were cultured in cell medium without or with TGF-β (including 10 ng/ml TGFB1, 50 ng/ml TGFB2, and 10 ng/ml TGFB3) for 24 h. The blots shown are representative of three images captured. GAPDH was used as a loading control. e Effects of Smad3 expression vectors (pSmad3) on the transiently transfected Nppc gene promoter enhancers (R2 and R8) fused to luciferase reporter vectors in KK1 cells. pNppc represents pGL3.0-basic plasmid containing R2 or R8 region of the Nppc promoter. KK1 cells were treated without or with TGF-β for 24 h. Bars indicate the mean ± SEM of three independent replicates. Values not indicated by the same letter are significantly different (P < 0.05)

