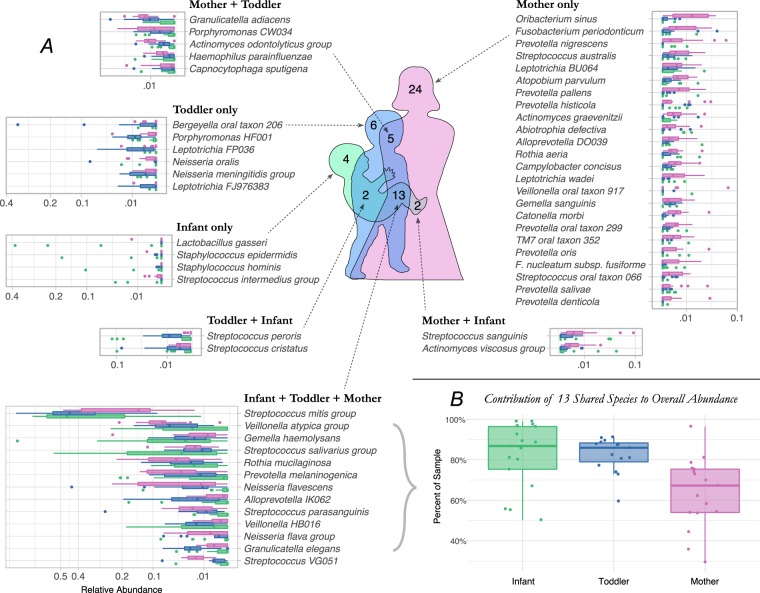
Figure 1.
Oral microbial communities in mothers, infants, and toddlers. (A) Venn diagram and relative abundance boxplots for species detected in mothers, infants and toddlers are shown. Number of species detected for each Venn intersection are shown within the diagram, and species are listed for each intersection. For each species, boxplots show square root-adjusted relative abundances for infants (green), toddlers (blue) and mothers (pink). Only species that met empirical probability thresholds were included. (B) The contribution to total microbial relative abundance of those 13 species present at all ages are shown in boxplots.

