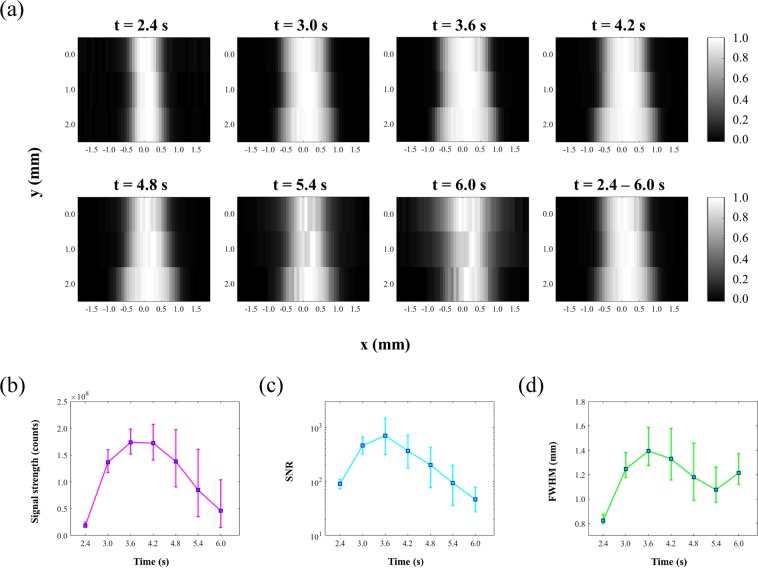
Figure 3.
(a) USF images of the silicone tube when counting USF signal from different CCD camera recording time t = 2.4 s, 3.0 s, … 6.0 s. (b) Relationship between USF signal strength acquired on the center of the tube and CCD camera recording time. (c) Relationship between the signal-to-noise ratio (SNR) of USF images and CCD camera recording time t. (d) Relationship between the full width at half maximum (FWHM) of imaged tube and CCD camera recording time t.

