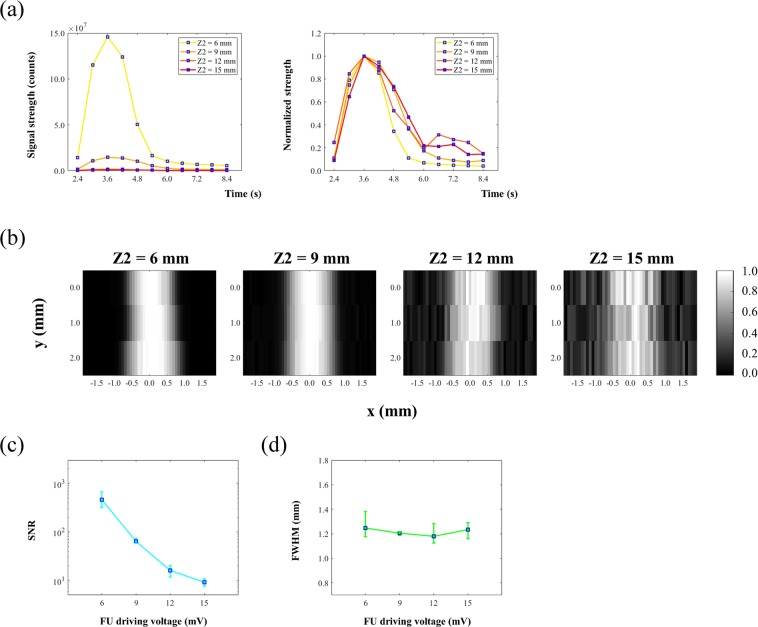
Figure 5.
(a) USF signals acquired at x = 0.00 mm, y = 0.00 mm, in the four phantoms with different Z2 = 6, 9, 12 and 15 mm. In the left plot, it shows the USF signal strength significantly decreased with the increase of Z2. In the right plot it shows the normalized signal strengths over time: the USF signal duration changed slightly when the Z2 increased. (b) Normalized 2D USF images acquired at different imaging depth Z2 = 6, 9, 12 and 15 mm. (c) Relationship between SNR of imaged tube and imaging depth Z2. (d) Relationship between FWHM of imaged tube and imaging depth Z2.

