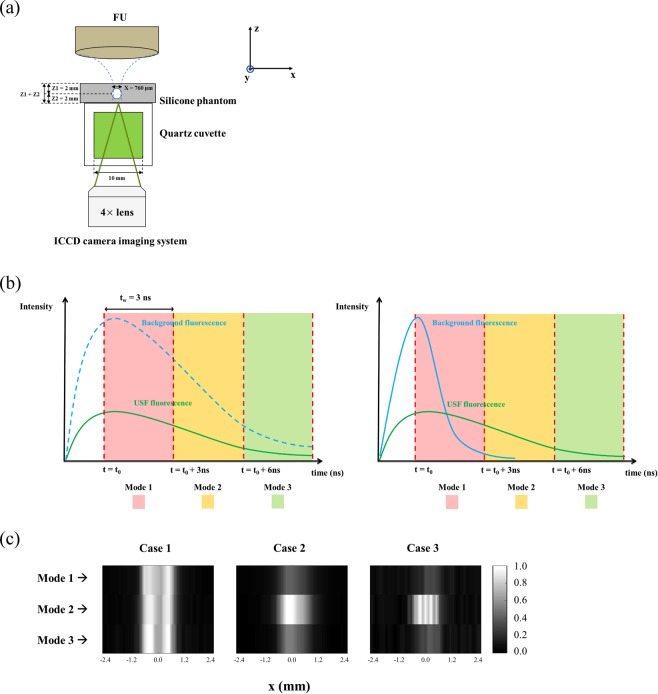
Figure 6.
(a) Silicone phantom and USF signal measurement setup. (b) Scheme of the three selected time-gated window (i.e., mode 1, mode 2, and mode 3) for the three cases: the left panel represents Case 1 in which both the background and the USF signal had similar lifetimes and decayed at a similar speed; the right panel represents Case 2 and 3 in which the background had a short lifetime and decayed fast while the USF signal had a long lifetime and decayed slowly. (c) USF images acquired at the three modes for the three cases.

