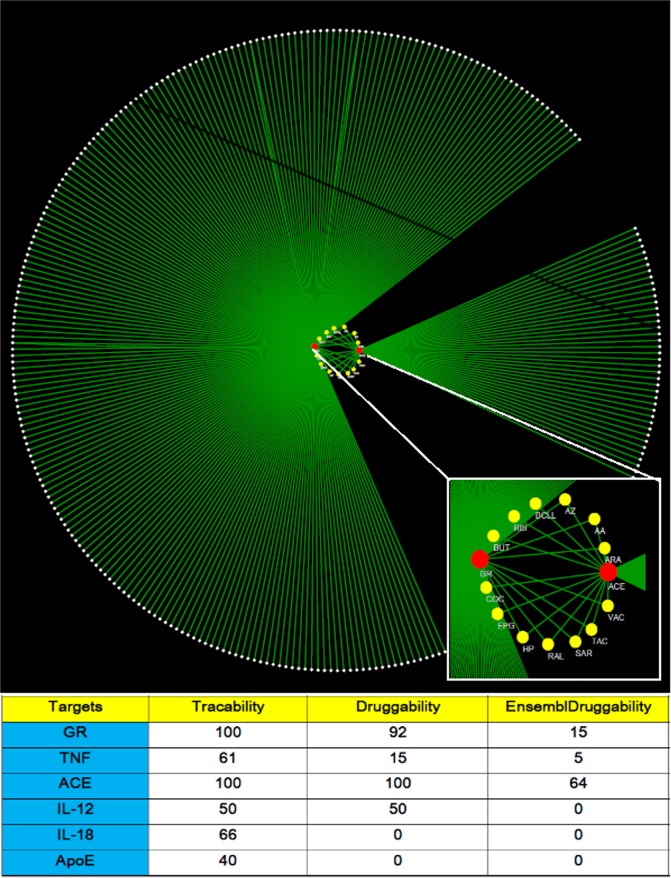
Figure 5.
Network of ACE and GR and associated chemical molecules. The network was built with Cytoscape (v. 3.7.1) from data obtained from CTD for the most druggable targets ACE and GR. White nodes represent compounds interacting only with one target, yellow nodes represent compounds (drugs and toxicants) interacting with both targets, and red nodes represent the targets. Edges (green) are different types of interactions of compounds with targets accordingly to CTD. The table indicates the druggability parameters for each of the five possible targets.

