Fig. 1.
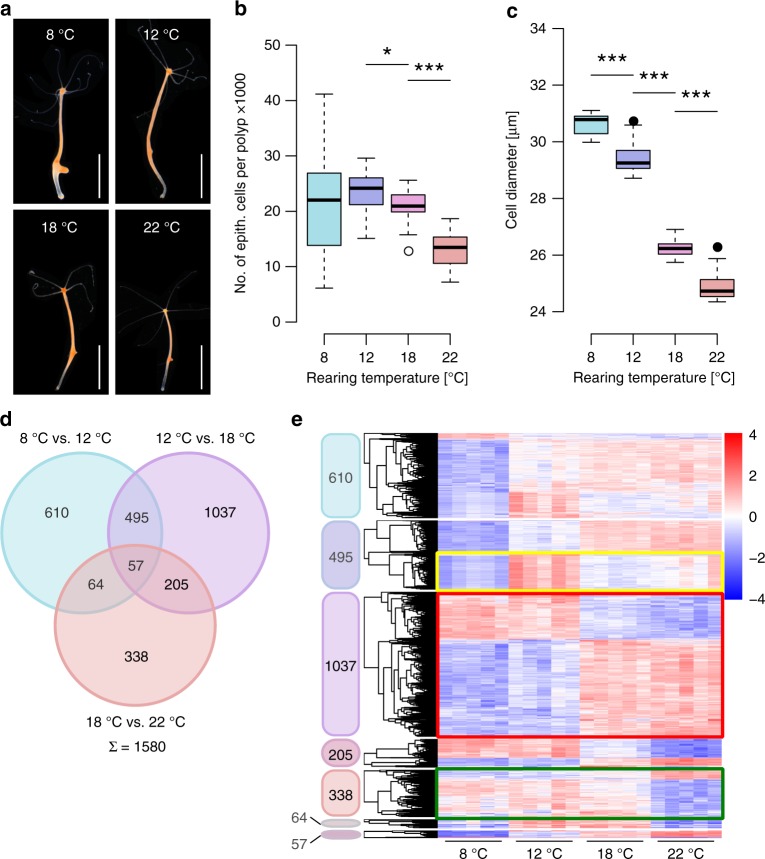
Temperature-induced phenotypic plasticity. a Hydra polyps reared at 8 °C, 12 °C, 18 °C and 22 °C at maximum polyp size with first bud protrusion. Scale bar: 5 mm. b, c Clonal Hydra polyps reared at temperatures from 8 °C to 22 °C showed decreasing cell numbers and cell size of epithelial cells at maximum size. Boxplots show median (horizontal line), lower and upper quantile (box), lower and upper 1.5 times interquartile range (whiskers) and outliers (points). n = 16 samples/1043640 cells (8 °C), 18 samples/1376686 cells (12 °C), 18 samples/1318035 cells (18 °C), 11 samples/479968 cells (22 °C), *p ≤ 0.05, ***p ≤ 0.001 (U-test + FDR-correction). d Venn diagram showing number of differentially expressed genes comparing the different temperature treatments (8 °C vs. 12 °C, 12 °C vs. 18 °C, 18 °C vs. 22 °C). A total of 1580 genes (bold) are associated with a significant change in maximum size by temperature shift. e Heatmaps representing the relative expression level of the differentially expressed genes (rows) from the venn diagram over the different temperatures. Genes were clustered hierarchically per heatmap. Expression values were log2-transformed and median-centered by transcript. n = 5 libraries (Wald-Test + FDR-correction)

