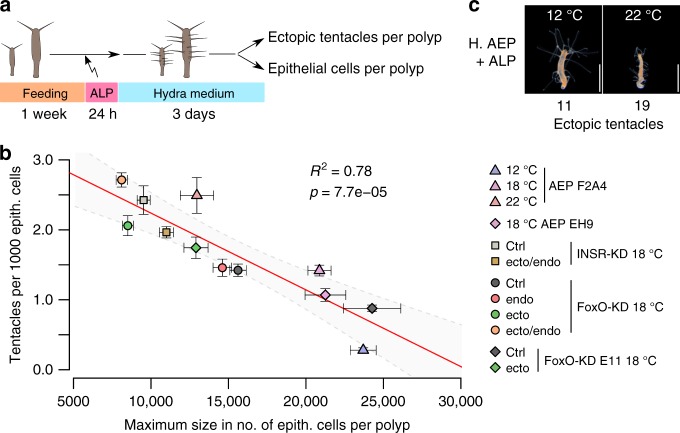
Fig. 4.
Axis stability as a readout for maximum size. a Schematic representation of experimental design: After one week of feeding, polyps were treated with ALP. After three days of incubation in HM, ectopic tentacles were counted manually and current size of the same animal was determined using flow cytometry. b Scatter plot showing a negative correlation between the maximum size of a Hydra line and the responsiveness to ALP treatment. Smaller lines produced more ectopic tentacles per epithelial cells than larger lines. The linear regression line is shown in red, the 95% confidence interval in light gray. R2 represents the coefficient of correlation. Points and whiskers show mean values and standard error. n = 15 polyps/18 samples (12 °C F2A4), 6 polyps/18 samples (18 °C F2A4), 8 polyps/11 samples (22 °C F2A4), 12 polyps/12 samples (18 °C EH9), 19 polyps/20 samples (INSR-KD ctrl), 20 polyps/20 samples (INSR-KD ecto/endo), 10 polyps/15 samples (FoxO-KD D11a ctrl), 15 polyps/16 samples (FoxO-KD D11a endo), 8 polyps/16 samples (FoxO-KD D11a ecto), 6 polyps/16 samples (FoxO-KD D11a ecto/endo), 13 polyps/5 samples (FoxO-KD E11 ctrl), 17 polyps/5 samples (FoxO-KD E11 ecto) (tentacles per 1000 epith. cells/maximum size, ANOVA). c Clonal animals reared at 12 °C or 22 °C four days after ALP treatment. Note that smaller animals at 22 °C respond stronger to ALP than 12 °C polyps. Scale bar: 2 mm

