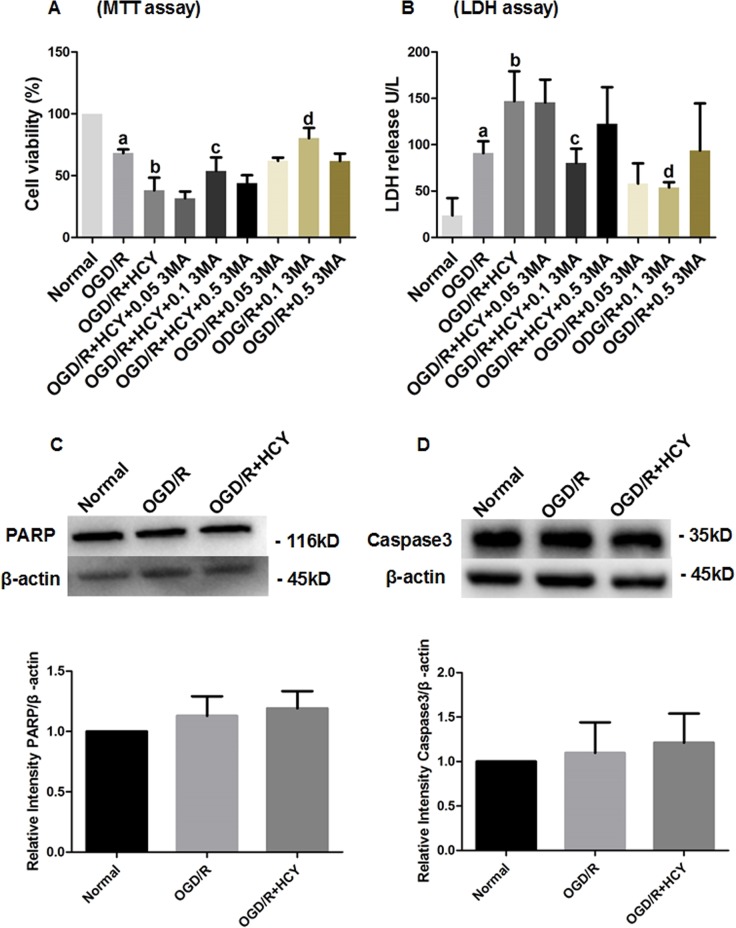
Fig. 1. Effects of 3MA treatment on Hcy-induced cytotoxicity in OGD/R NSCs.
a After exposure to 3MA at three different concentrations (0.05, 0.1, or 0.5 mM) for 72 h, the cell viability was detected by the MTT assay. b Cell necrosis was evaluated by the measurement of LDH in media. 0.05, 0.1, and 0.5 mM 3MA was used in the OGD/R + HCY + 0.05 3MA, OGD/R + HCY + 0.1 3MA, and OGD/R + HCY + 0.5 3MA groups, respectively. The data are average of three independent experiments. Note that the percentage of cell viability of other groups is normalized to the normal group. Data are expressed as mean ± SD. a P < 0.05 compared with the normal group. b, d P < 0.05 compared with the OGD/R group. c P < 0.05 compared with the OGD/R + HCY group. c Representative western blot for PARP. Quantification of PARP/β-actin graphed below. d Representative western blot for caspase 3. Bar graphs show semiquantitative levels of caspase 3 as determined by band density analysis. Data from three independent experiments. Note that the quantification of PARP or caspase 3 of other groups is normalized to the normal group. Data are expressed as mean ± SD. P > 0.05

