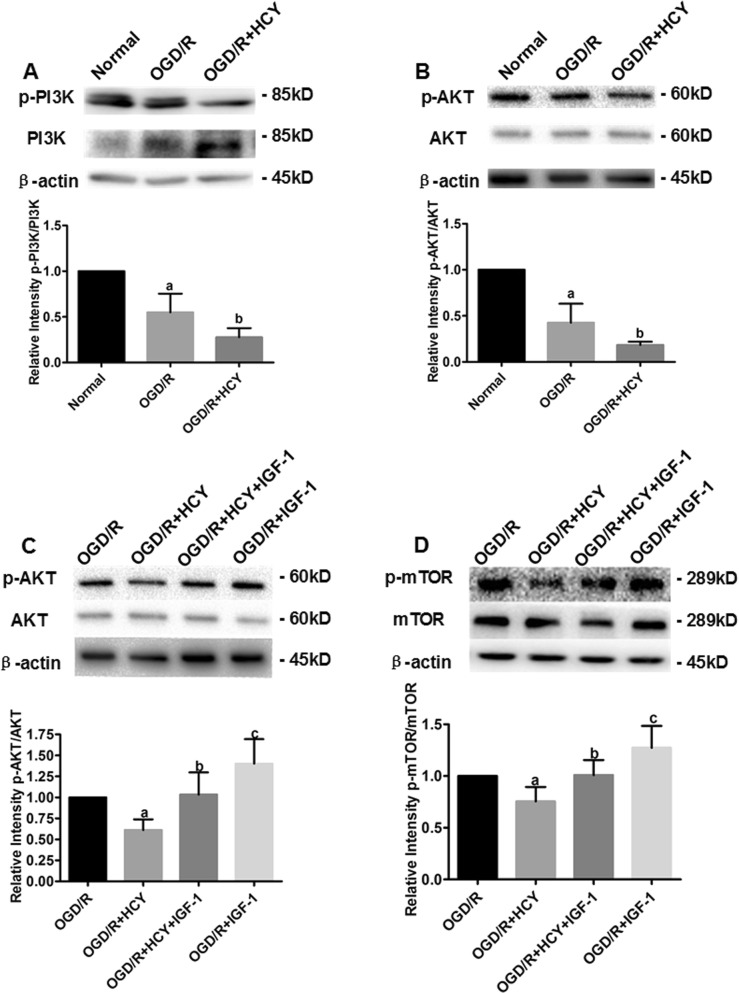
Fig. 6. Hcy increases autophagy in NSCs after OGD/R-injury by inhibiting the PI3K-AKT-mTOR signaling pathway.
a, b Representative western blot for p-PI3K and p-AKT, respectively. Bar graphs show semiquantitative levels of p-PI3K and p-AKT as determined by band density analysis. Data from three independent experiments. Note that the quantification of p-PI3K or p-AKT of other groups is normalized to the normal group. Data are expressed as mean ± SD. a P < 0.05 compared with the normal group. b P < 0.05 compared with the OGD/R group. c, d Representative western blot for p-AKT and p-mTOR, respectively. Bar graphs show semiquantitative levels of p-AKT and p-mTOR as determined by band density analysis. Data from three independent experiments. Note that the quantification of p-AKT or p-mTOR of other groups is normalized to the OGD/R group. Data are expressed as mean ± SD. a, c P < 0.05 compared with the OGD/R group. b P < 0.05 compared with the OGD/R + HCY group

