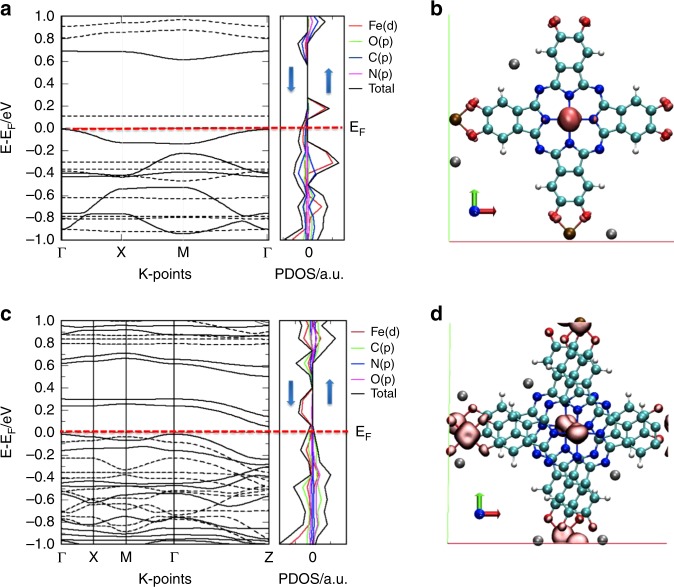
Fig. 2.
Modeling of the electronic structures of K3Fe2[PcFe–O8]. a Band structure of a monolayer K3Fe2[PcFe–O8] with GGA + U correction shown on the left panel, dashed lines indicate the bands associated to spin up while the solid lines indicate the bands associated to spin down (the effective Coulomb (U) and exchange (J) terms reported in the Supplementary Information). The corresponding projected density of states (PDOS) for spin up and spin down are plotted on the right panel for Fe(d), C(p), O(p), and N (p) states; b Spin density iso-surface (pink solid iso-surface), at absolute spin-density |ρ ↑–ρ↓| = 0.05 electrons per Å3 of a monolayer K3Fe2[PcFe–O8], indicating that the spin density is mainly localized on the Fe ions (light cyan: C; blue: N; red: O; light red: Fe; gray: K+); c Calculated electronic band structure of multi-layered K3Fe2[PcFe–O8] with AA-serrated stacking mode; d Unit cell of two-layered K3Fe2[PcFe–O8] in AA-serrated stacking mode with ferromagnetic arrangement

