Fig. 3.
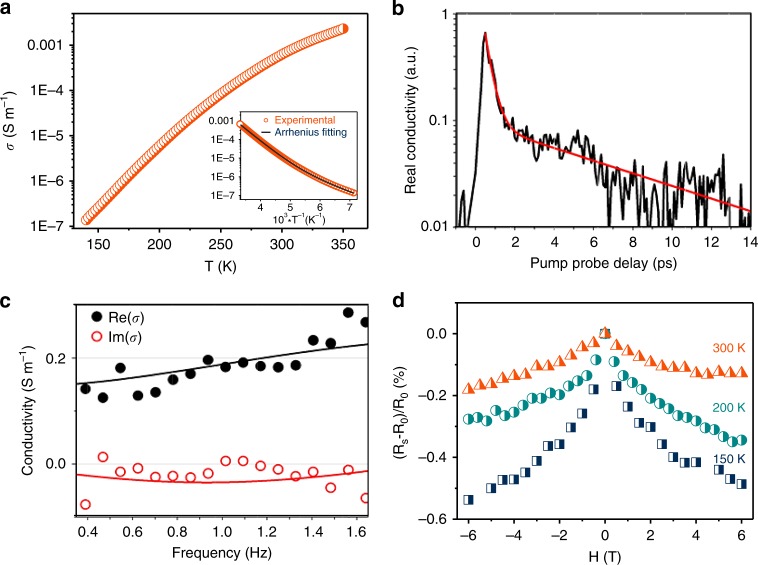
Charge transport and magnetoresistance of K3Fe2[PcFe–O8]. a Variable-temperature electrical conductivity of compressed K3Fe2[PcFe–O8] pellets via van der Pauw method; Insert: Plot of electrical conductivity of K3Fe2[PcFe–O8] as a function of inverse temperature (T−1); b Room-temperature photoconductivity of K3Fe2[PcFe–O8] measured by optical pump-THz probe spectroscopy (800 nm excitation wavelength 300 μJ cm−2 and ~1 THz bandwidth probe; under nitrogen environment). Red line represents a bi-exponential decay function; c Real (black dots) and imaginary (red dots) components of the frequency-resolved complex conductivity (measured at 0.5 ps after photoexcitation, DC conductivity 0.14 S m−1); solid lines represent a Drude-Smith description of the data; d, Magnetic field dependence of the magnetoresistance by measuring the changes of the electrical resistance in an applied field (−6–6 T) at different temperatures

