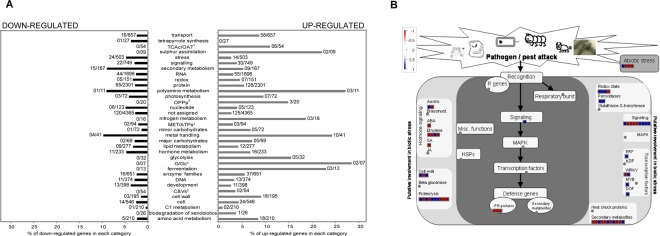
Figure 1.
Transcripts differentially expressed in rice roots colonised by H. seropedicae were grouped according to metabolic categories according to MapMan. Overview metabolism is shown in Panel A and biotic and abiotic stress in Panel B. (A) Up-regulated genes are shown in the right-hand column (in gray) and down-regulated genes in the left column (in black). Numbers of regulated genes and total numbers of expressed genes are shown for each category. 1TCA cycle/organic acids: 2oxidative pentose phosphate pathway; 3mitochondrial electron transport/ATP synthesis; 4gluconeogenesis/glyoxylate cycle; 5cofactor and vitamin synthesis. (B) The scheme was constructed using only genes with fold change ≥2; ≤2. Small squares represent up-regulated (blue) or down-regulated (red) genes.

