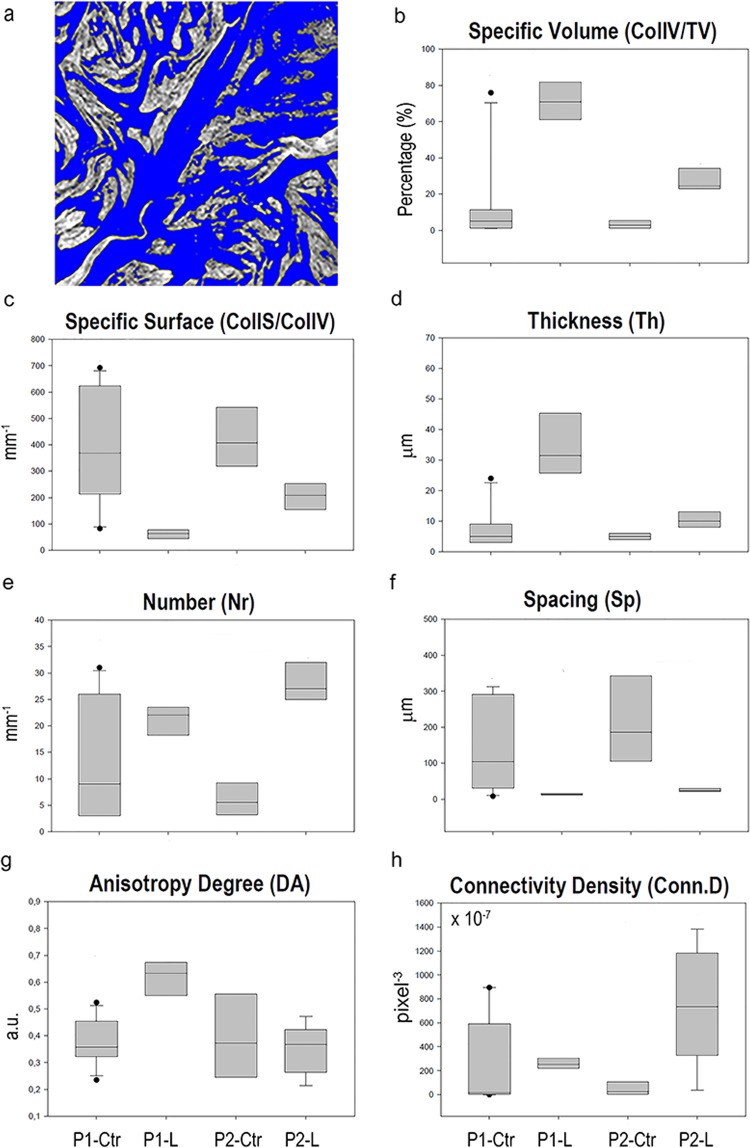
Figure 2.
1st level analysis: study of the collagen morphometric quantification. (a) Sampling 2D slice of a pathologic biopsy where the histogram has been segmented according to the application of the Mixture Modeling algorithm. Blue phase: smooth muscle; graded grey phase: collagen bundles. (b–h) Box-plots graphically depicting groups of the extracted collagen morphometric parameters through their quartiles, as a function of the selected groups of samples P1-Ctr, P1-L, P2-Ctr and P2-L.

