Figure 6.
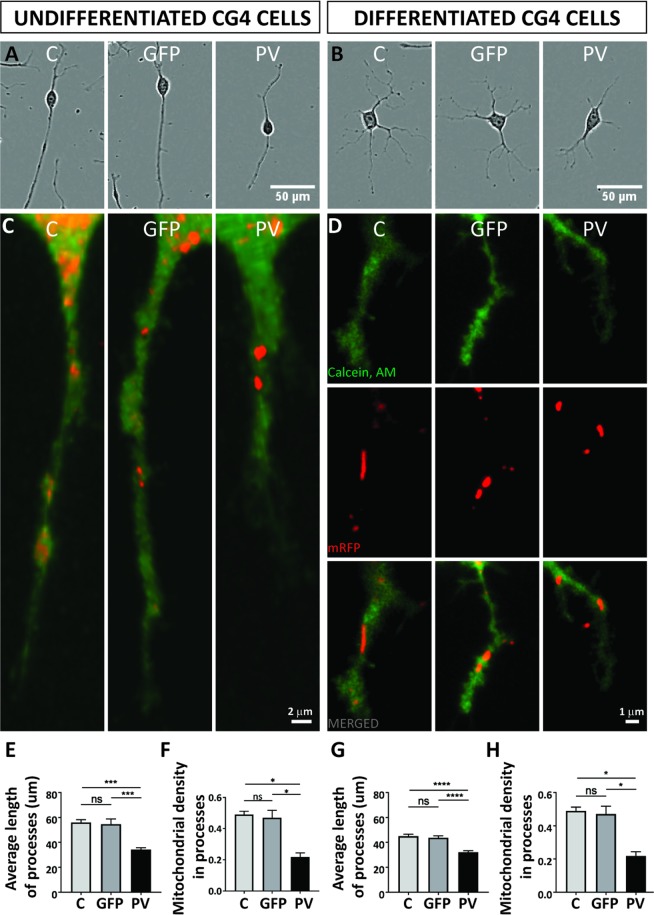
PV overexpression affects mitochondrial density and position of mitochondria in distal cellular processes. Representative CG4 cells are depicted from IncuCyte images (A,B). Mitochondria were visualized by mitochondria-targeted red fluorescent protein (red) and cellular processes were visualized by Calcein-AM (green). Representative images are shown for C-, GFP- and PV-CG4 cells (C,D). In (D) separate images for cytoplasm (green, upper), mitochondria (red, middle) and merged images (lower) are shown. In addition, average length of processes (E,G) and mitochondrial density in the processes (F,H) was analyzed. Cellular process length of CG4 cells was evaluated by automatically acquired real-time images by the IncuCyte Imaging system. Single cells were analyzed and the length of cellular processes was measured. Average process’ length was evaluated by measuring total length of all processes per cell and dividing this number by the number of processes in the same cell. Error bars represent SEM, *p < 0.05, **p < 0.01, ***p < 0.001, ****p < 0.0001.

