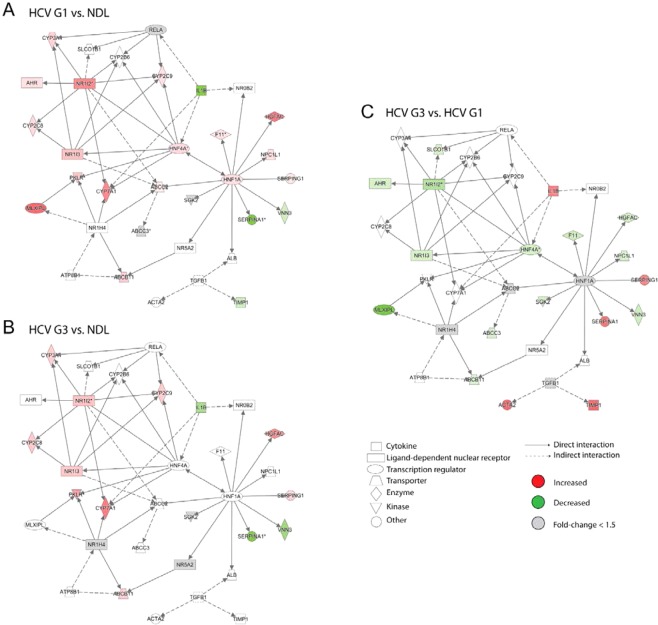
Figure 4.
Differentially expressed genes in the ‘Lipid Metabolism, Molecular Transport, Small Molecule Biochemistry’ pathway. Expression data overlayed onto these networks was visualised for differentially expressed genes between HCV genotype 1 (HCV G1) compared to non-diseased liver (NDL) (A); HCV genotype 3 (HCV G3) compared to NDL (B); and HCV G1 compared to HCV G3 (C). Node colours corresponds to fold changes of differentially expressed genes (red = up-regulated; green = down-regulated; grey = genes not meeting the significance threshold of −1.5< fold change <1.5).

