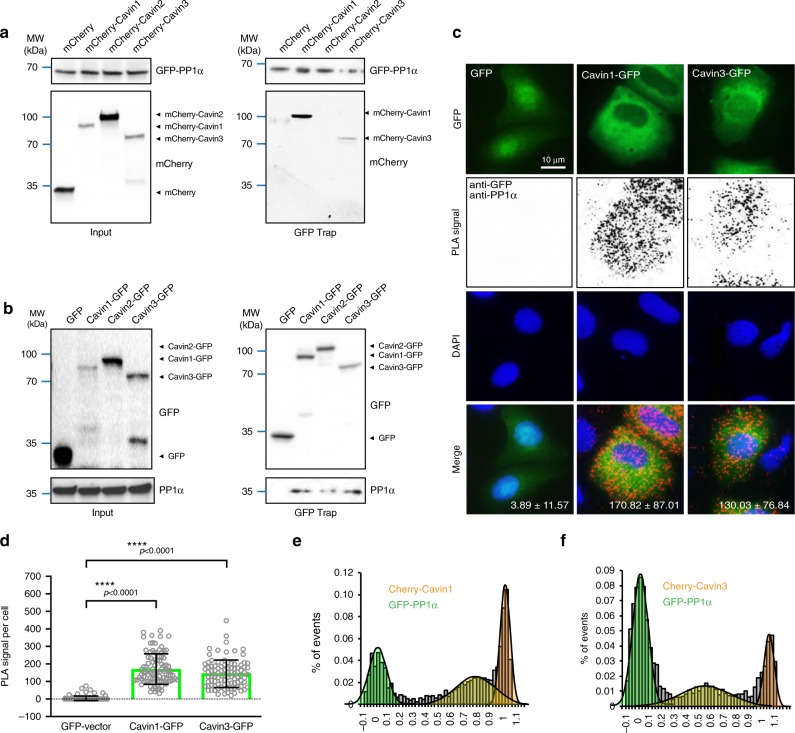
Fig. 2.
Interaction between the cavin proteins and PP1α. a GFP Trap assays of MCF-7 cells cotransfected with GFP-PP1α and mCherry-vector, mCherry-Cavin-1, -2 or -3. Transfection efficiency was examined in the input material (left panel). mCherry was detected in the GFP pulldown samples by western blot analysis (right panel). b Input and pulldown samples for GFP Trap assays of Cavin-GFP cells were analyzed by western blotting for GFP and PP1α, with GFP-vector as the negative control. c In situ PLA detection (red puncta) of the interaction between GFP-cavins and endogenous PP1α in MCF-7 cells using anti-GFP (mouse) and anti-PP1α (rabbit) antibodies. DNA was stained by DAPI (blue). Red puncta per cell is represented as mean ± SEM for three experiments from different fields of view. Scale bar, 10 μm. d Quantification of PLA puncta/cell for 150 total cells (n = 50 cells per experiment, three independent experiments) from different fields of view. Black colored lines in the scatter plot represent the mean ± SD, ****p-value (one-way ANOVA) < 0.0001 versus negative control (GFP-vector/PP1α). e–f Single-molecule coincidence detection between GFP-PP1α and mCherry-Cavin1 (e) or mCherry-Cavin3 (f). Coincidence ratio value (C) = intensity (A549 nm)/total intensity

