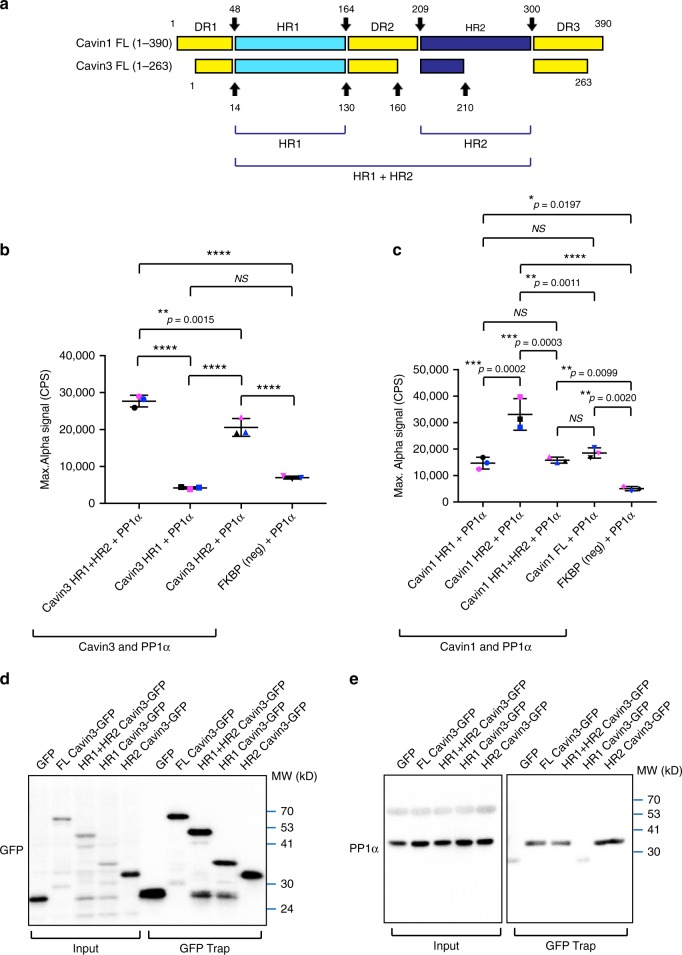
Fig. 3.
PP1α interacts with the HR2 domain of Cavin3 and Cavin1. a Schematic representation of the helical regions (HR)1 and HR2 regions of Cavin1 and Cavin3. b AlphaLISA screen of Cavin3 HR1 domain, Cavin3 HR2 domain, and Cavin3 HR1+HR2 domain and PP1α, FKBP, and PP1α (negative control), **p-value < 0.01, ****p-value < 0.0001 (one-way ANOVA). NS = no significance. Scatter dots in each group represent the values from three independent experiments (labeled by three colors). c AlphaLISA screen of Cavin1 HR1 domain and PP1α, Cavin1 HR2 domain and PP1α, Cavin1 HR1+HR2 domain and PP1α, Cavin1 FL and PP1α, and FKBP and PP1α (negative control), *p-value < 0.05, **p-value < 0.01, ***p-value < 0.001, ****p-value < 0.0001 (one-way ANOVA). Mean ± SD are presented for three sets of experiments. d–e GFP-tagged full-length Cavin3 (lane 2) and truncation mutants (HR1+HR2) domain, HR1 domain or HR2 domain were expressed in MCF-7 cells followed by lyzed GFP Trap pulldown assays. Transfection and pulldown efficiency were examined by western blot analysis using anti-GFP antibodies (d). Endogenous PP1α (e) was detected by western blotting using PP1α specific antibodies. Results are representative of three independent experiments

