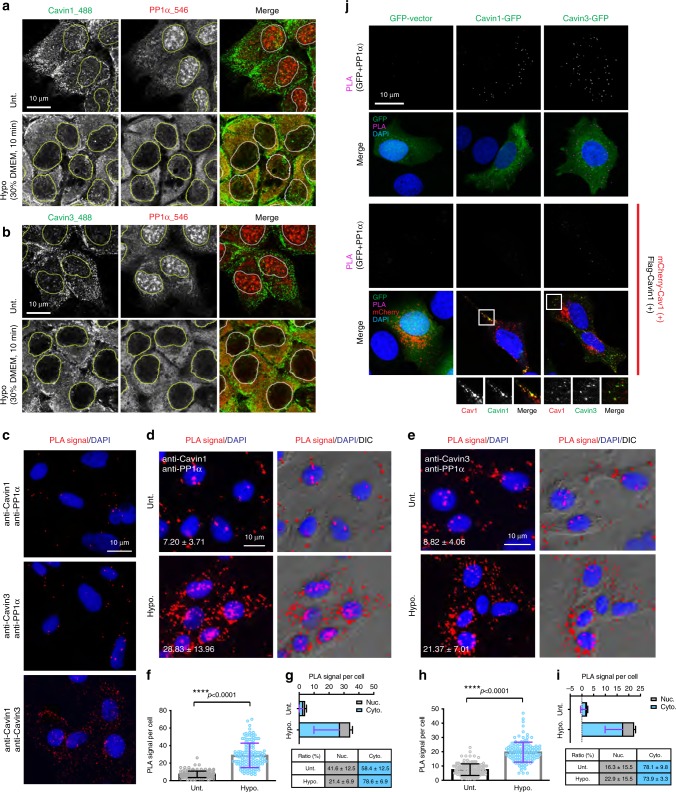
Fig. 4.
Hypo-osmotic interactions of endogenous PP1α and cavin proteins. a, b Representative immunofluorescence images of endogenous Cavin1 (green) and PP1α (red) (a) or Cavin3 (green) and PP1α (red) (b) in untreated or hypo-osmotic treated A431 cells. Yellow or white circles (in merged images) indicate the outline of the nucleus. Scale bar, 10 μm. Images are representative of three independent experiments. c Representative images of PLA signals (red)/cell representing the interactions of endogenous PP1α/Cavin1 or PP1α/Cavin3 in A431 cells from three independent experiments. Cavin1/Cavin3 interaction was used as a positive control. DAPI was used to visualize nuclear DNA (blue). Scale bar, 10 μm. d, e PLA signal/cell of Cavin1/PP1α and Cavin3/PP1α interactions in A431 cells with or without hypo-osmotic treatment. The PLA signals between cells were distinguished by the matched DIC microscopy and are represented as the mean ± SD. Scale bar, 10 μm. f, h Quantitation of PLA signals for the Cavin1/PP1α (f) and Cavin3/PP1α (h) interactions upon hypotonic treatment, n = 150 cells for three independent experiments. ****p-value (Student’s t-test, two tail) < 0.0001. g, i The number and ratio (%) of nuclear (Nuc.) and cytoplasmic (Cyto.) localized PLA signal for Cavin1/PP1α (g) and Cavin3/PP1α (i) interactions was quantified using CellProfiler, where DAPI staining was utilized for nuclear identification. Histogram represents the mean ± SD values of PLA signal number in each cell from three independent experiments (n = 50 cells for each experiment). Cytoplasmic and nuclear signals were labeled as blue and gray. The values of the ratio are presented in in the table as mean ± SD. j MCF-7 cells transfected with GFP-cavins and GFP-vector (upper two panels), or with additional mCherry-CAV1 and Flag-Cavin1 (not expressed in Cavin1-GFP cells) (lower two panels). PLA signals for the interaction between GFP and PP1α were detected and visualized as magenta puncta in merged images. PLA signal images alone were inverted to gray scale. Enlarged images showing the colocalization between mCherry-CAV1 and GFP-tagged Cavin1 and Cavin3 are presented. Scale bar, 10 μm. Images are representative of three independent experiments

