Figure 1.
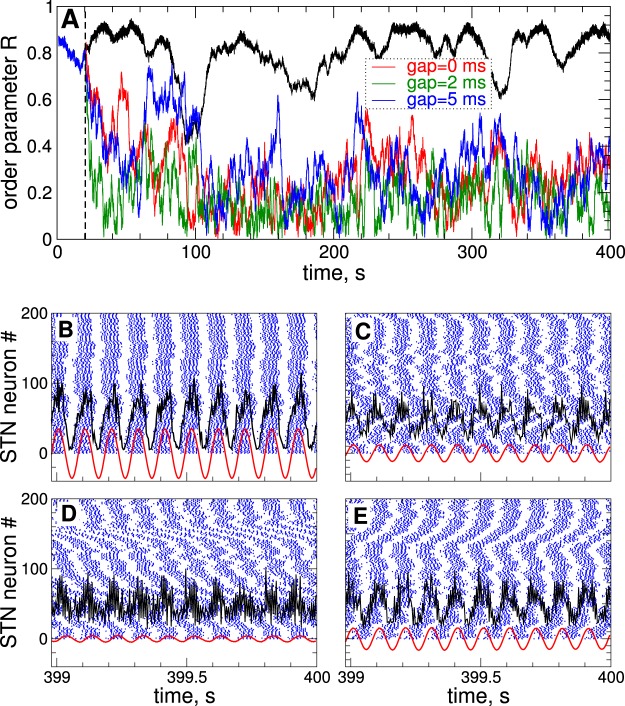
Synchronized dynamics of the STN-GPe neuronal populations (1)–(4) and its suppression by continuous HF DBS. (A) Time courses of the order parameter R of STN neurons without stimulation ( in equation (1), upper black curve) and stimulated by cDBS for different widths of the interphase gap as indicated in the legend. The stimulation starts at as indicated by the vertical dashed line with parameter of the stimulation intensity . (B–E) Examples of raster spike plots of STN neurons (blue dots) for (B) (no stimulation) and (C–E) and interphase gap (C) , and (D) 2 ms, and (E) 5 ms. Black and red curves depict raw and filtered LFP, respectively, scaled by the factor 1000.

