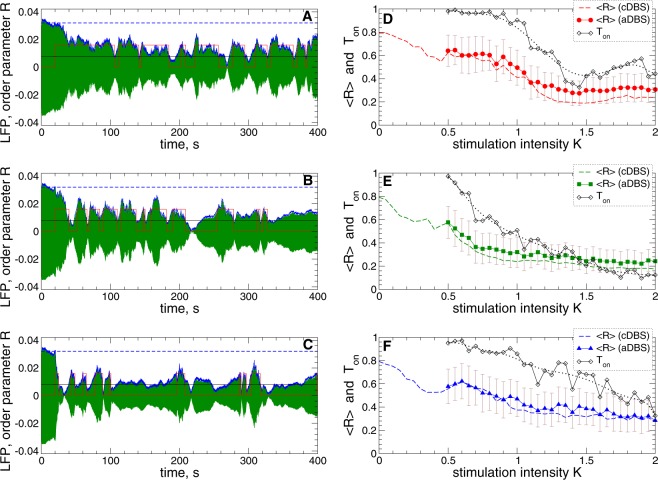
Figure 4.
Suppression of synchronization in the STN-GPe neuronal populations (1)–(4) by adaptive HF DBS. (A–C) Time courses of the filtered LFP (green curves) and the order parameter (blue curves, scaled by the factor 1/25) of STN neurons stimulated by aDBS started at for the interphase gap (A) and (B,C) and stimulation intensity (A,B) and (C) . The scaled value of of the synchronized and stimulation-free STN neurons [Fig. 1A, black curve, and Fig. 3A for ] is indicated by horizontal blue dashed lines for comparison. The red stepwise curves indicate the on- and off-epochs of aDBS for the LFP thresholds (upper value of the red stepwise curves) and (black horizontal line). (D–F) Averaged order parameter versus stimulation intensity K for aDBS (filled symbols) and cDBS (dashed curves, copied from Fig. 3A for comparison) as indicated in the legends for the interphase gap (D) , (E) 2 ms, and (F) 5 ms. The standard deviation of the order parameter fluctuations for aDBS is indicated by error bars. The fraction of the stimulation time Ton (black diamonds) of aDBS, where HF DBS was switched on, and its smoothed values (black dotted curves) are also shown.

