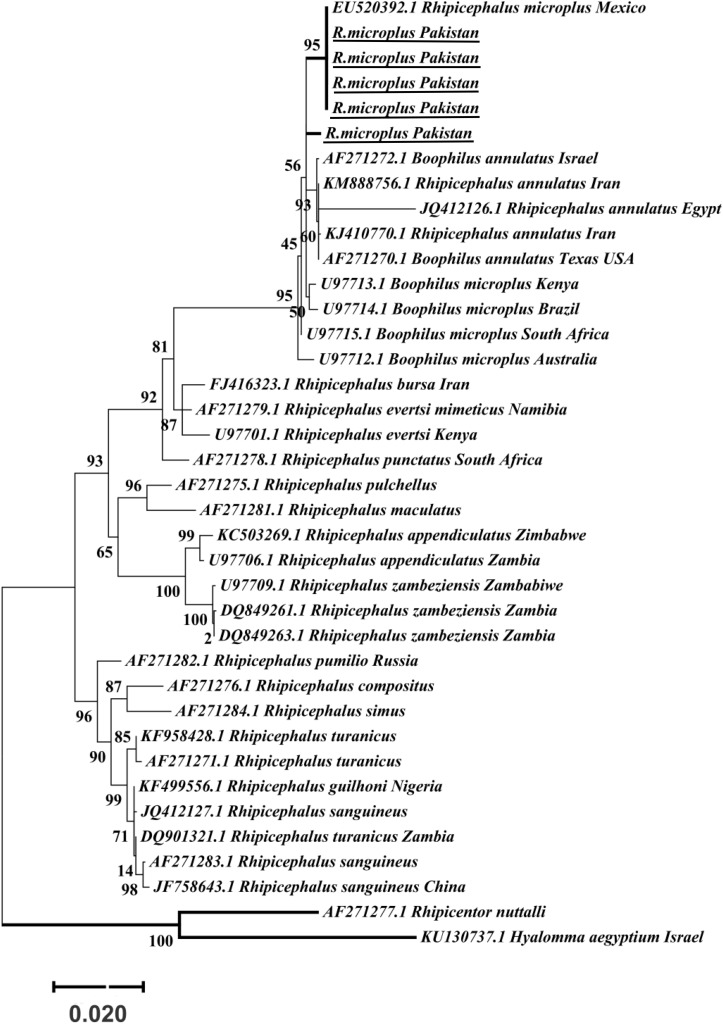
FIGURE 5.
Maximum likelihood tree inferred from ITS2 sequences of the genus Rhipicephalus and using Rhipicentor and Hyalomma sequences as outgrowth. GenBank accession numbers are followed by species name and collection location. Support values (Bootstrapping values) were indicated at each node. The bar represents 0.020 substitutions per site. Sequences obtained in the present study were underlined.

