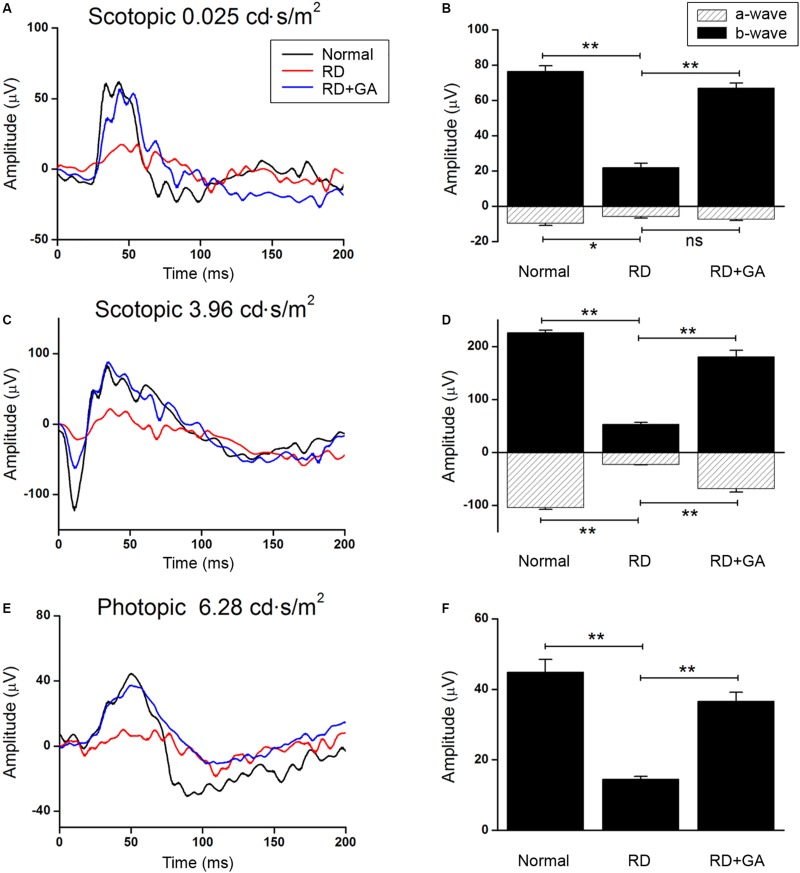
FIGURE 2.
ERG recordings to evaluate the functional effect of GA on blue LED-induced RD. (A–D) Scotopic ERG recordings at 0.025 (A) and 3.96 cd.s/m2. (C) Light intensities were obtained from the normal control mice (dark curve), untreated control RD mice (red curve), and GA-treated RD mice (blue curve), respectively. Quantitative analyses of the a- and b-wave amplitudes of the ERGs were denoted with filled- and dashed-columns (B,D). (E) Photopic ERG recordings at 6.28 cd.s/m2 light intensity were carried out from the normal control, RD control, and GA-treated RD mice. (F) Quantitative analysis of b-wave amplitudes of the photopic ERG results was summarized in a bar graph. The data are shown as the mean ± SEM; n = 6, *P < 0.05, ∗∗P < 0.01.

