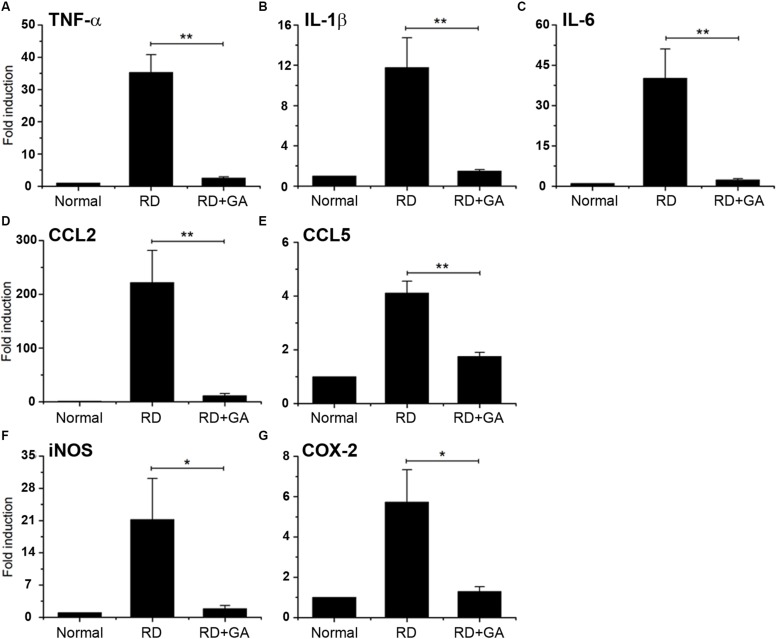
FIGURE 5.
Real-time qPCR analysis to evaluate the anti-inflammatory effect of GA on blue LED-induced RD. (A–G) mRNA expression levels of TNFα (A), IL-6 (B), IL-1β (C), CCL2 (D), CCL5 (E), iNOS (F), and Cox-2 (G) in GA-treated RD retinas at 3 days after RD were significantly reduced, compared to those in the untreated RD retinas. Data are shown as mean ± SEM; n = 5, *P < 0.05, ∗∗P < 0.01.

