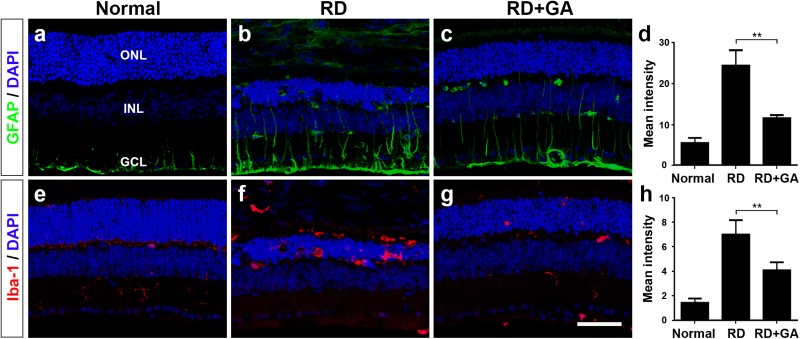
FIGURE 6.
Immunohistochemistry and image analyses to evaluate glial responses of GA on blue LED-induced RD. (a–h) Confocal micrographs from vertical sections of normal (a,e), untreated RD control (b,f), and GA-treated RD retinas (c,g) processed for GFAP (green in a–c) and Iba-1 (red in e–g) immunoreactivities. Quantitative image analyses of the immunoreactivities for GFAP (d) and Iba-1 (h) were conducted. Both GFAP and Iba-1 immunoreactivities were significantly reduced in the retinas of the GA-treated group, compared with the untreated RD group. Scale bar, 50 μm. Data are shown as mean ± SEM; n = 5, ∗∗P < 0.01.

