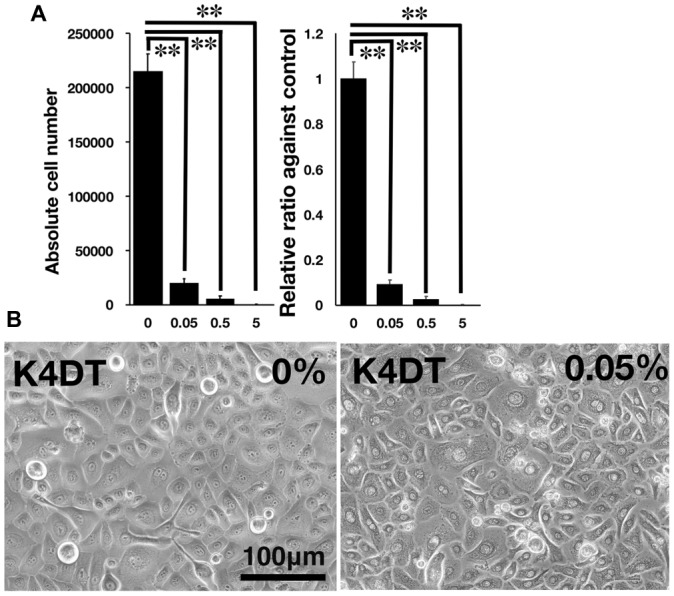
Figure 3.

Detection of toxicity of Benzalkonium chloride using the STE method. (A) The number of K4DT cells. The data are expressed as the mean, with the error bars representing the standard error. Two stars indicate a statistical significance of more than 1%. (B) Cell morphology of PBS-treated (control) K4DT cells (left panel) and 0.05% Benzalkonium chloride-treated K4DT cells (right panel).
