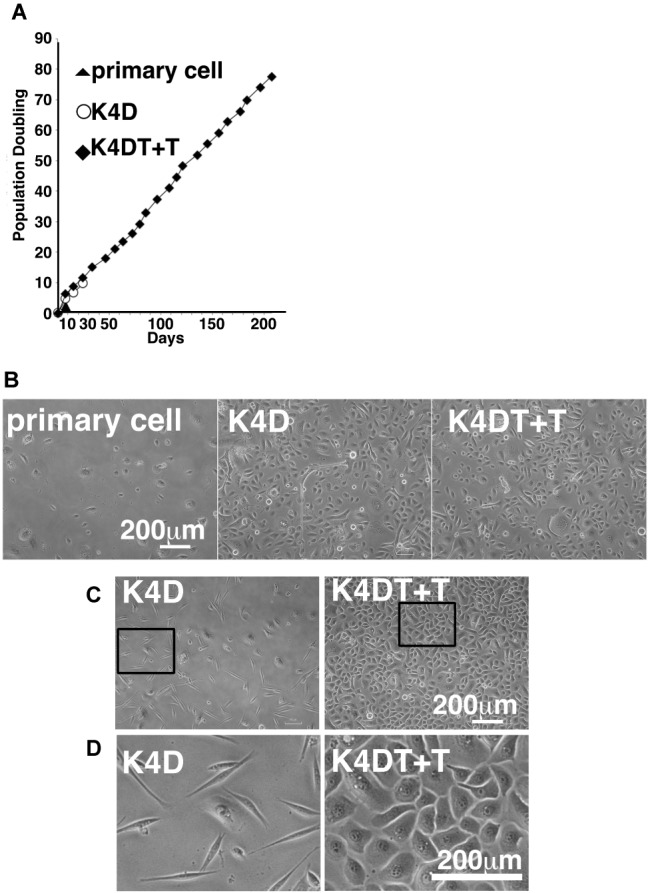
Figure 8.

Cell growth status and morphological observation of primary, K4D, and K4DT + T cells. (A) Cell growth and sequential passaging of primary, K4D, and K4DT + T cell. Cell growth is represented by the cumulative population doubling value. (B) Morphological observation at passage 1 in the population doubling assay. (C) Cell morphology of K4D and K4DT + T cells at passage 3. Lower magnification of K4D (left panels) and K4DT + T cells (right panels). (D) Higher magnification of K4D cells (left panels) and K4DT + T cell (right panels).
