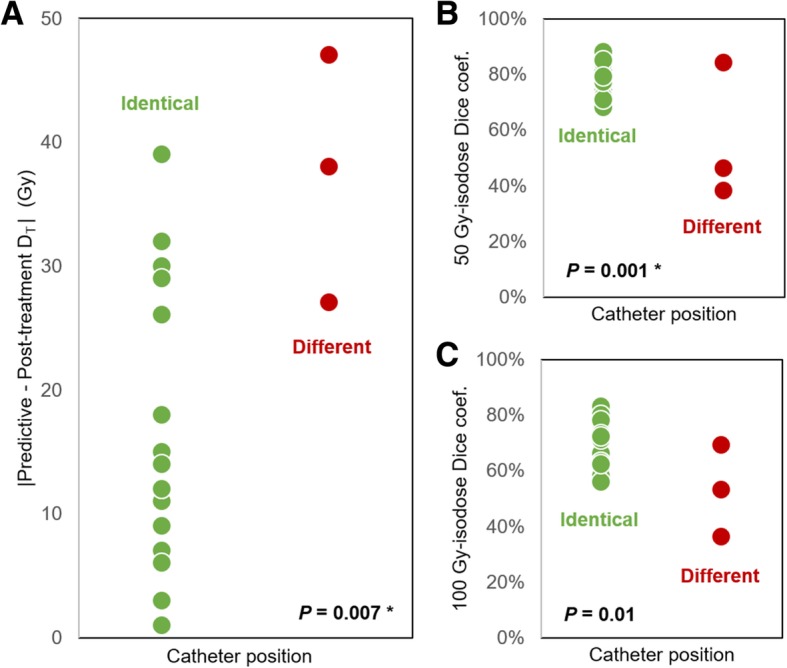
Fig. 3.

Difference in dose distribution between normalized 99mTc-MAA SPECT and 90Y-microsphere PET. a Absolute mean dose difference according to the catheter position. Dice coefficient similarity according to the catheter position for 50 Gy isodoses (b) and 100 Gy isodoses (c). Asterisks (*) indicate P values that remained significant in multivariate analysis
