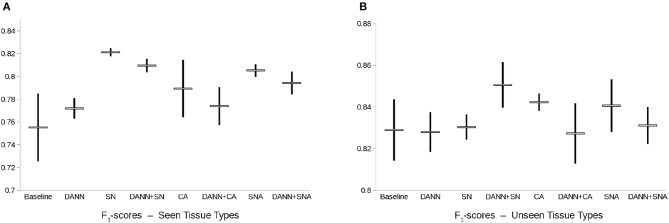
Figure 5.
Box-plot of the F1-score of the nuclei segmentation models. Points represent the mean ± standard deviation of the F1-score of each model across 3 repeats with random initialization and random patch sampling. DANN, Domain-Adversarial Neural Network; CA, Color Augmentation; SN, Staining Normalization; SNA, Staining Augmentation.

