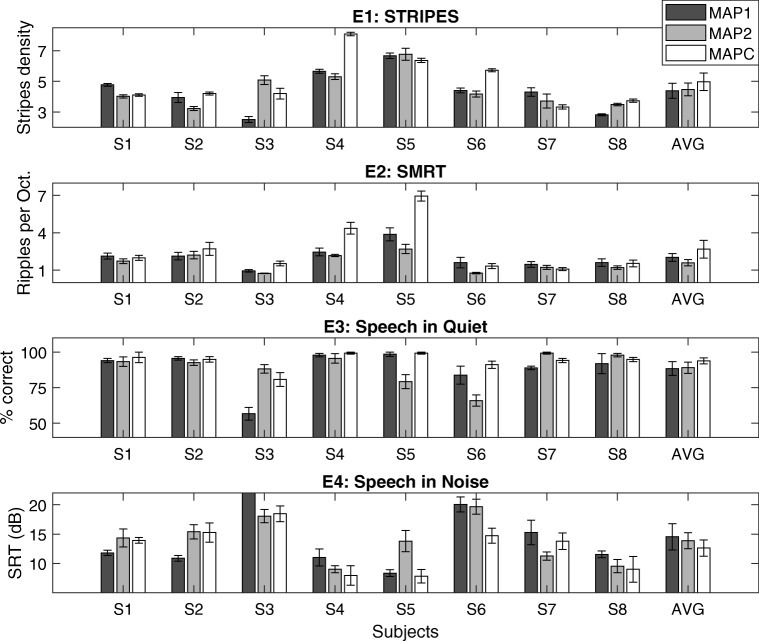
Fig. 7.
Individual results by all subjects and on average using the three experimental MAPs for all four evaluation tests (E1, STRIPES; E2, SMRT; E3, Speech in Quiet; E4, Speech in Noise). Error bars indicate the standard error of the mean. Asterisks indicate subject-level differences between MAPs (p < 0.05). S3 scored 27.4 dB SRT with MAP 1 for E4

