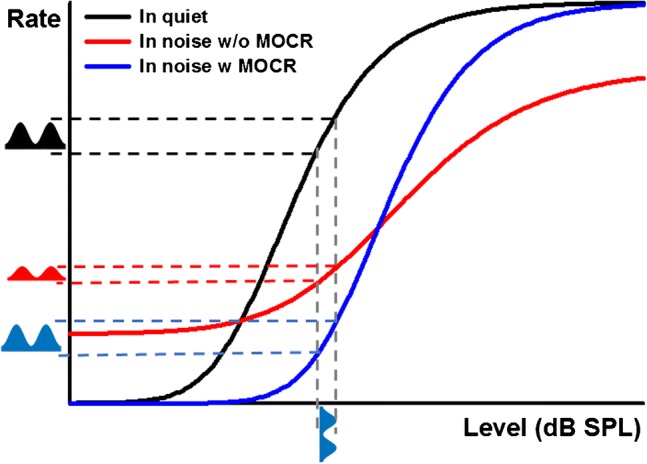
Fig. 1.

Schematic illustration of auditory-nerve rate-level functions for a tone in three conditions: (i) in quiet (black curve), (ii) near the onset of a simultaneous masking noise (red curve), and (iii) in the masking noise with the MOCR activated. Hypothetical responses to AM tone in the three conditions are illustrated by two cycles of a half-wave-rectified AM tone. The modulation depth of the fiber’s response to an AM tone in noise is decreased compared to that for a tone in quiet due to the shallow slope of the rate-level function (red vs. black symbols). The modulation depth is restored when the MOCR is activated (blue symbol)
