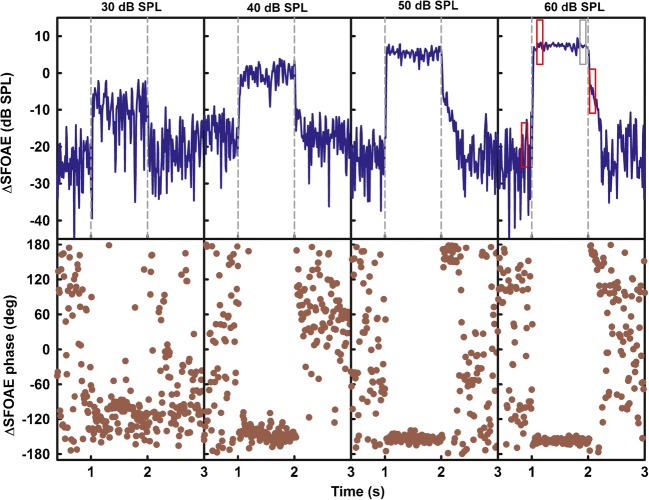
Fig. 7.
Changes in the SFOAE magnitude (top row) and phase (bottom row) due to a two-octave noise presented at levels provided on the top of upper panels. The ΔSFOAEs were measured using a 40-dB SPL probe tone with a nominal frequency of 1 kHz. Data are for one listener (S12). Red rectangles in the top right panel show temporal positions of windows over which the ΔSFOAE was averaged to estimate the noise floor, the suppression effects, and the post-elicitor MOCR effect. The gray rectangle shows the window used to estimate the combined effects of suppression and the MOCR

