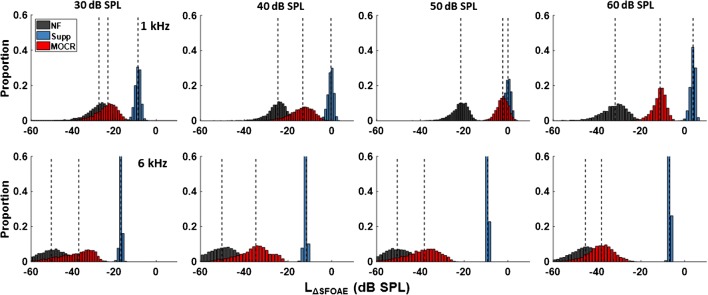
Fig. 8.
Examples of bootstrapped distributions of ΔSFOAE magnitude for one listener: NF (gray) denotes distributions for the noise floor, MOCR (red) denotes distributions for the post-elicitor effect, and Supp (blue) denotes distributions for suppression effects. The top and bottom rows show data for the nominal probe frequency of 1 and 6 kHz, respectively

