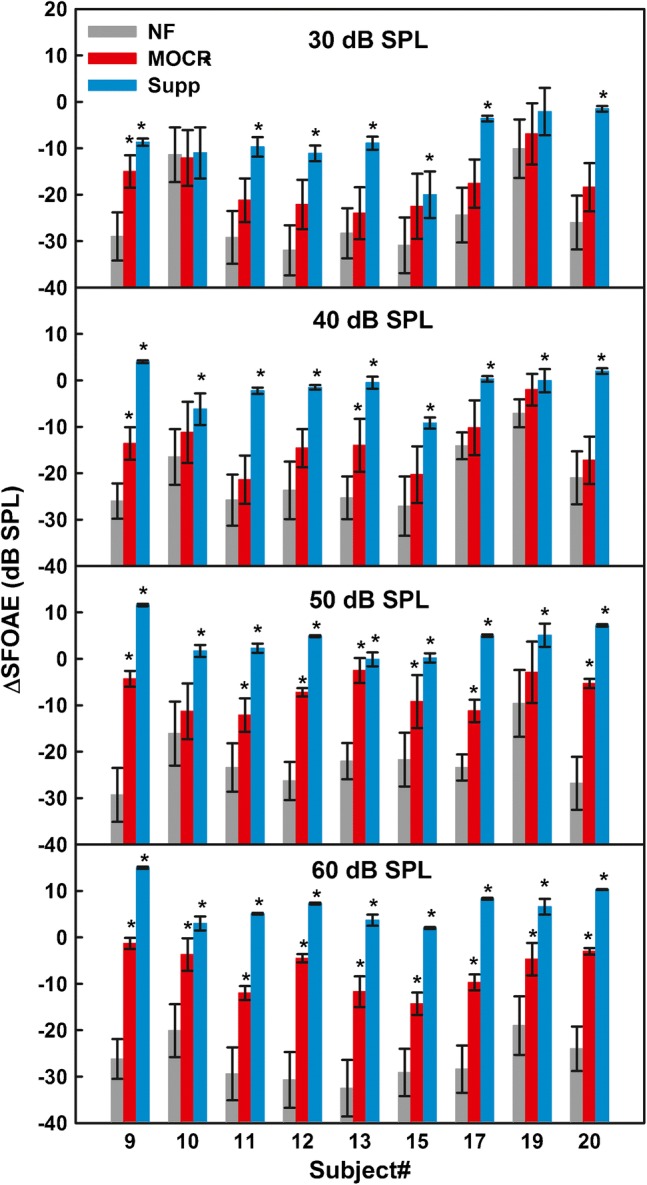
Fig. 9.

Means of the bootstrapped distributions for individual listeners, for the nominal probe frequency of 1 kHz. The error bars denote one standard deviation for the mean and the asterisks indicate cases where the mean ΔSFOAE was outside of the 95 % confidence interval for the noise-floor distribution
